by NelsonCorp Wealth Management | Apr 29, 2021 | Indicator Insights
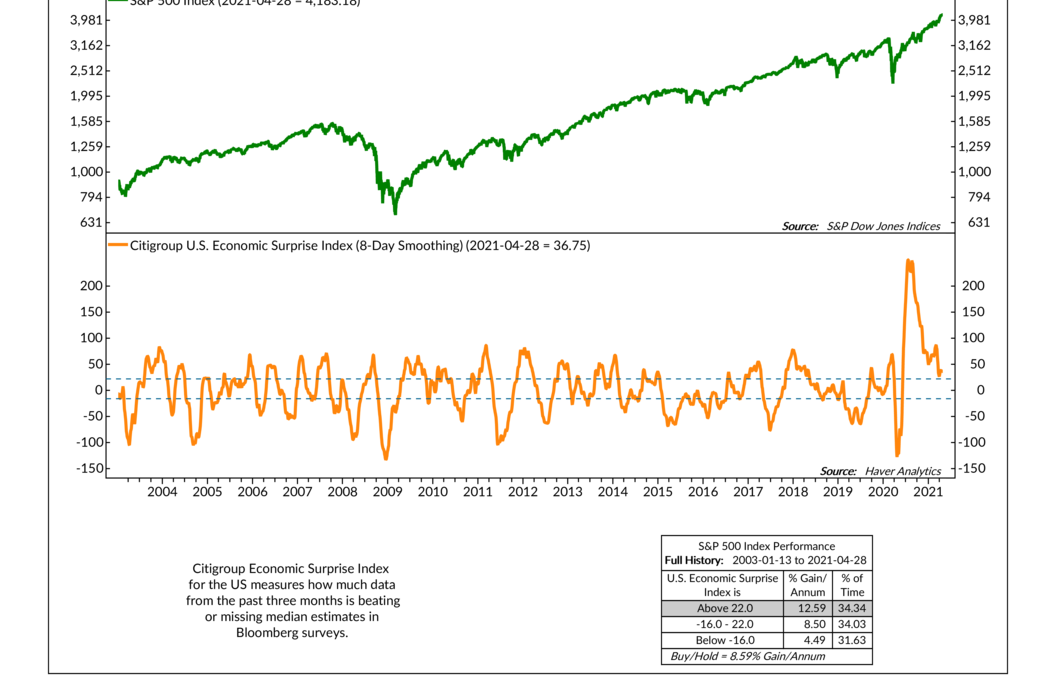
The Citigroup U.S. Economic Surprise Index is the focus of our featured indicator this week. The index—compiled by the investment bank Citigroup—tracks how economic data are coming in relative to forecasts based on Bloomberg surveys. Specifically, it evaluates...
by NelsonCorp Wealth Management | Apr 22, 2021 | Indicator Insights
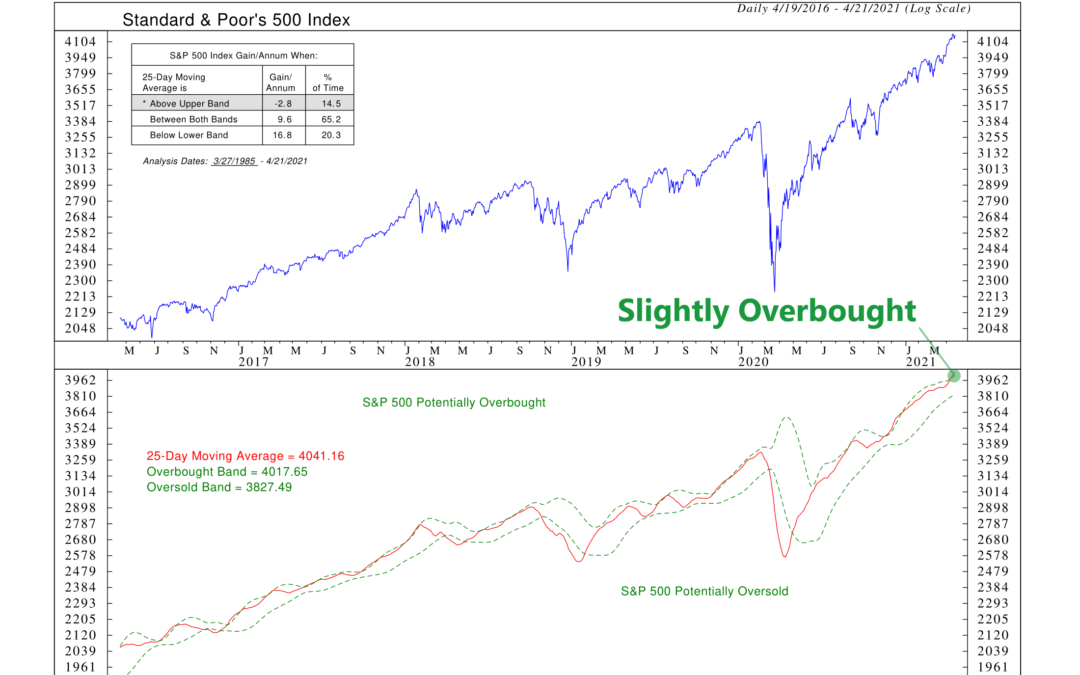
This week we focus on a concept regularly used in technical analysis known as “overbought/oversold.” The idea is fairly straightforward: Look at the recent price movement of a stock or stock index and determine if it is currently at an extreme—either too high...
by NelsonCorp Wealth Management | Apr 15, 2021 | Indicator Insights
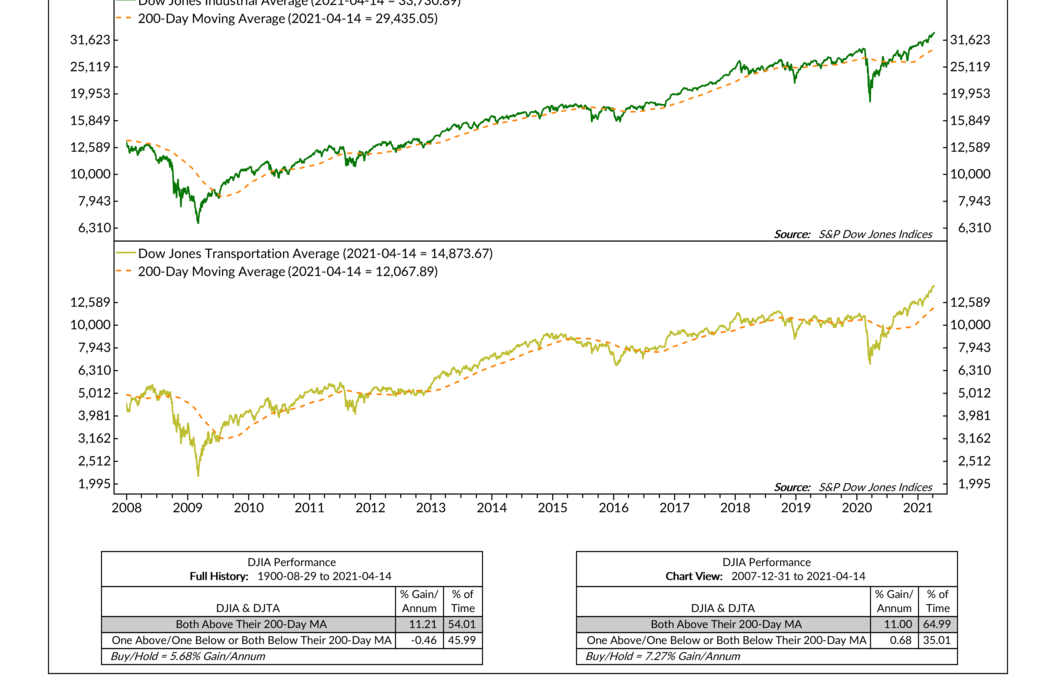
This week we look at one of the oldest indicators on Wall Street: Dow Theory. Initially developed by Charles H. Dow—the founder of Dow Jones & Company, Inc.—more than 100 years ago, the theory is based on the idea that both the Dow Jones Industrial Average...
by NelsonCorp Wealth Management | Apr 8, 2021 | Indicator Insights
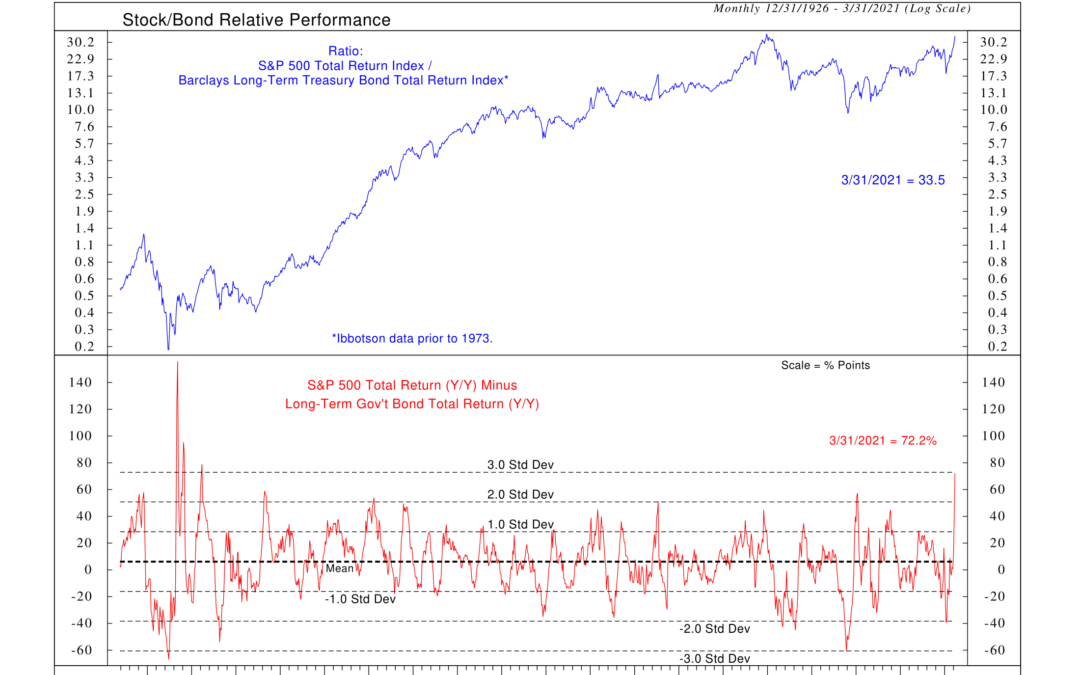
For this week’s indicator, we look at the relative performance of stocks versus bonds. These are the two financial assets that people are probably most familiar with. And if you’re saving for retirement, you likely have most of your savings invested in a mix...
by NelsonCorp Wealth Management | Apr 1, 2021 | Indicator Insights
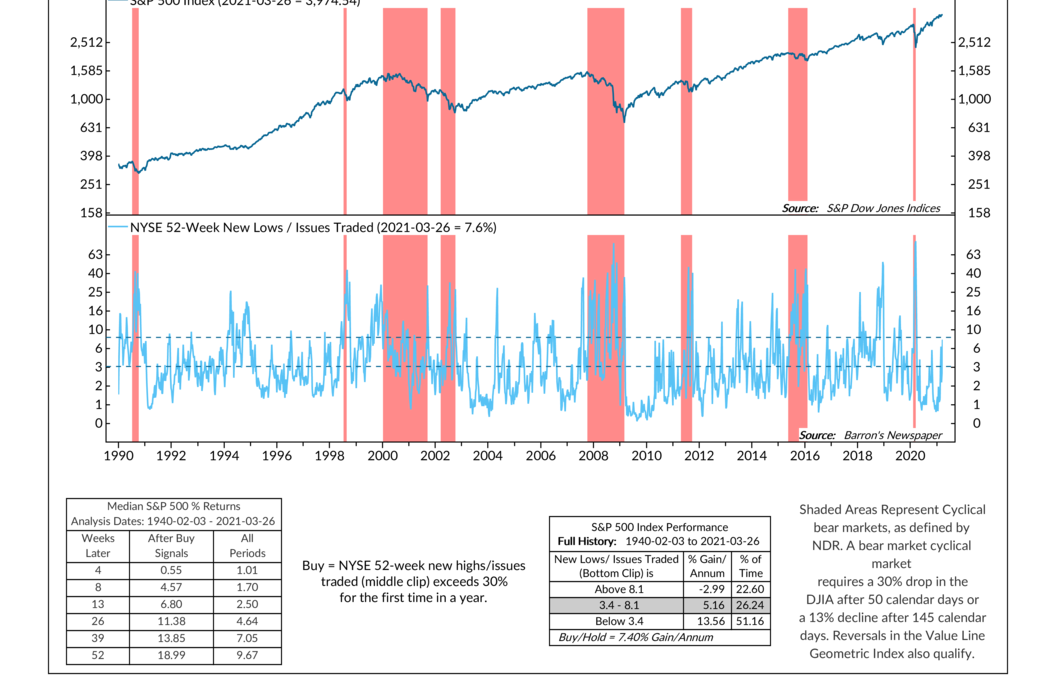
This week’s featured indicator looks at the percentage of stocks on the New York Stock Exchange (NYSE) making new 52-week lows. Since it tracks the percentage of stocks breaking down in price, we call it a measure of “downside leadership.” Why is this...
by NelsonCorp Wealth Management | Mar 25, 2021 | Indicator Insights
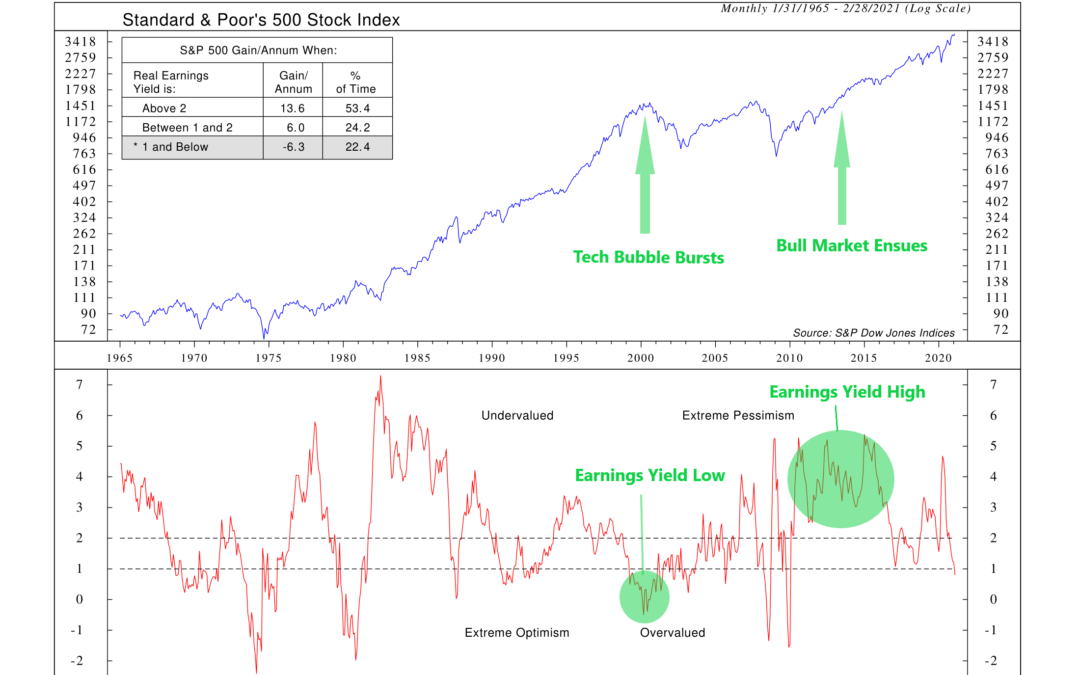
When you buy a stock, you are essentially paying for the earnings that the underlying business generates. If you compare how much a company is earning on a per-share basis relative to how much you pay for it, you get what is called an earnings yield. For...