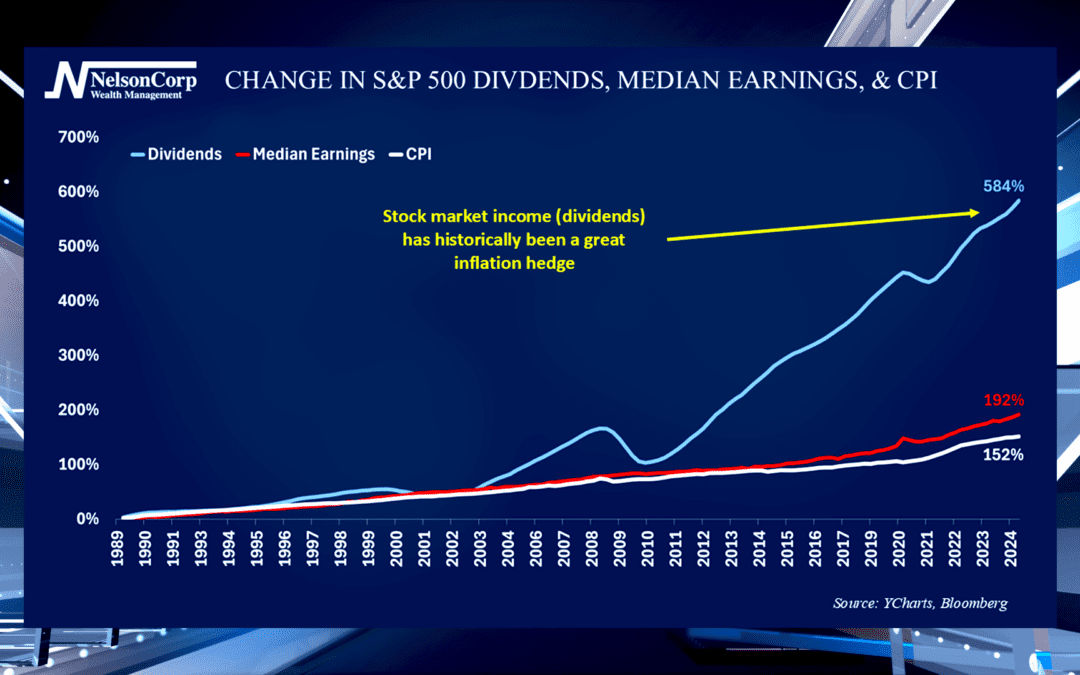
Inflation Hedge
With inflation still a major concern, investors want to know how to protect their purchasing power. David Nelson joins us to explain why investors should not ignore their assets income potential.
With inflation still a major concern, investors want to know how to protect their purchasing power. David Nelson joins us to explain why investors should not ignore their assets income potential.
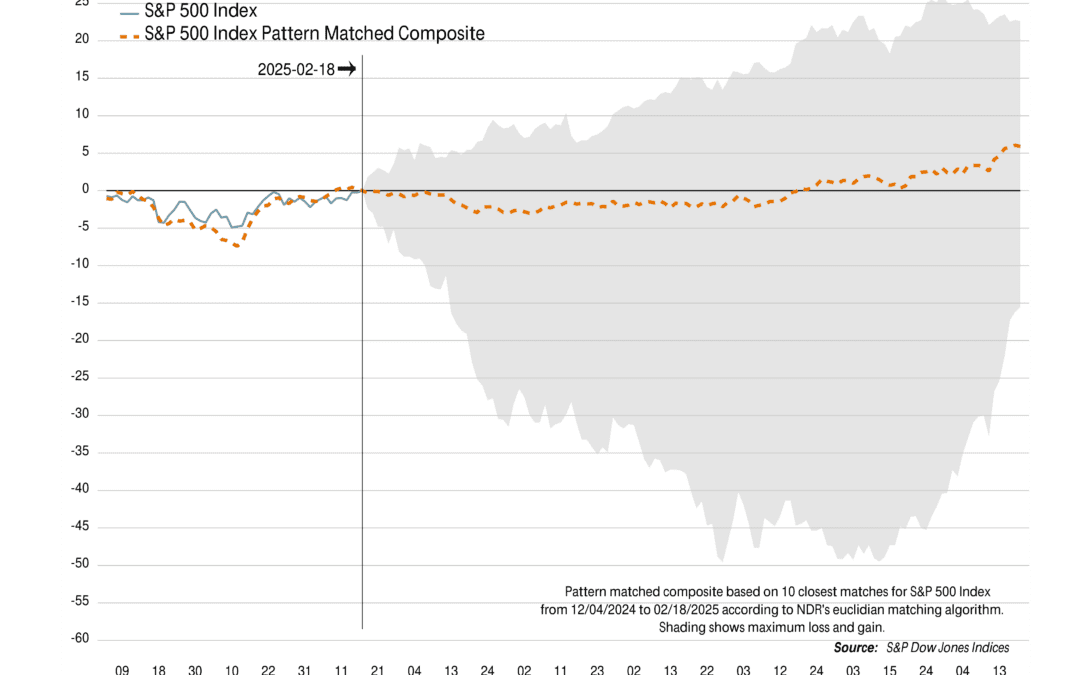
The market has been treading water, but the pressure is building for a big move. Will it be a breakout or a breakdown? History offers some clues—check out this week’s commentary to see what could be coming next!
Tax season is in full swing, and as the paperwork piles up, it’s a good time to stay organized and plan ahead for next year. Tune in as Nate and Andy break down the latest tax tips, the importance of preparation, and why kindness goes a long way during this busy season.