
Give Me Fuel
Margin debt is the topic of this week’s indicator. What is margin debt? It’s simply money borrowed from a broker for the purpose of buying stock. Typically, you see it used by speculators who wish to leverage their stock purchases, making it a great gauge of...
Financial Focus – April 19th, 2023
Tune in to the latest installment of Financial Focus, where Nate Kreinbrink is joined by special guest Andy Ferguson to delve into the key insights gained from the recently concluded tax season.
Risk vs. Reward
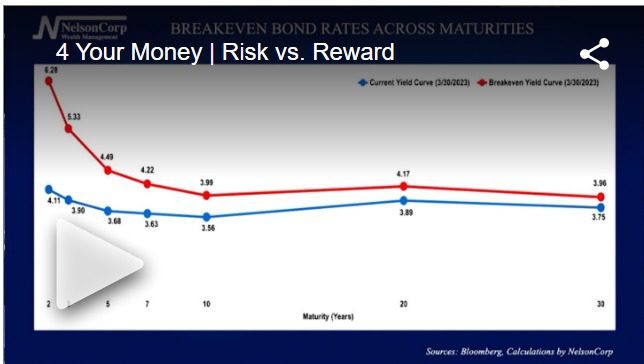
We talked last week about interest rates falling and how that could benefit investors who own bonds. This week, David Nelson tells us where he sees the most opportunity in the fixed-income space and how this information can help you make investment decisions in your portfolios.