by NelsonCorp Wealth Management | Dec 30, 2022 | Chart of the Week
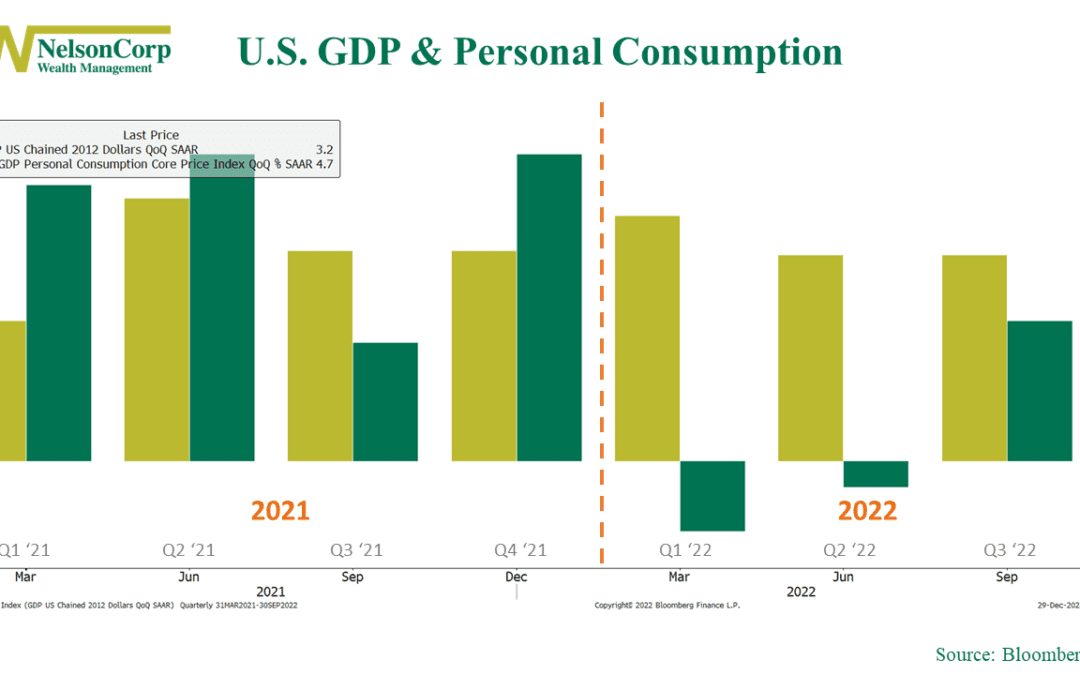
Our chart of the week above shows that the US economy faced a contraction in the first half of 2022 as GDP (green bars) declined in the first and second quarters, leading to concerns about a potential recession. However, as the gold bars reveal, consumer...
by NelsonCorp Wealth Management | Dec 29, 2022 | Indicator Insights
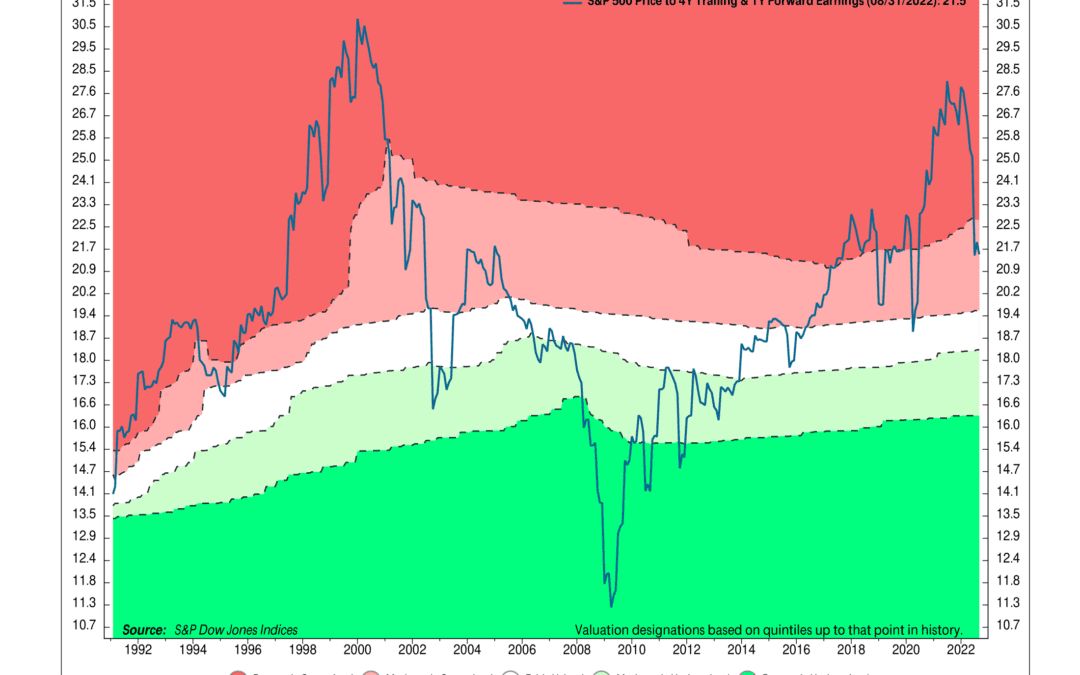
There are many ways to measure the valuation of something like the stock market. Some people like to look at past earnings; others look at future expected earnings. There is no “right” answer here. As they say, valuation is in the eye of the beholder. But we’ve...
by NelsonCorp Wealth Management | Dec 26, 2022 | Weekly Market Thoughts
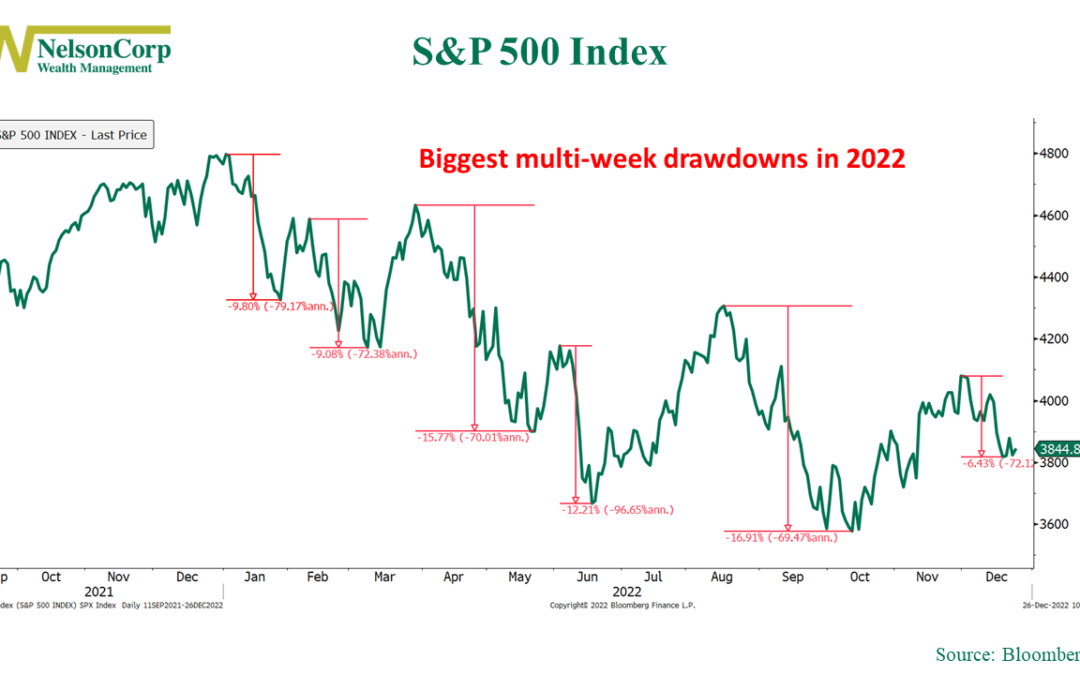
OVERVIEW Last week, the U.S. stock market experienced a mix of movements. The VIX Index, which measures volatility, decreased by approximately 7.7% to a level of 22. The S&P 500 Index decreased by 0.2%, the Nasdaq Composite fell by 1.94%, but the Dow Jones...
by NelsonCorp Wealth Management | Dec 23, 2022 | Chart of the Week
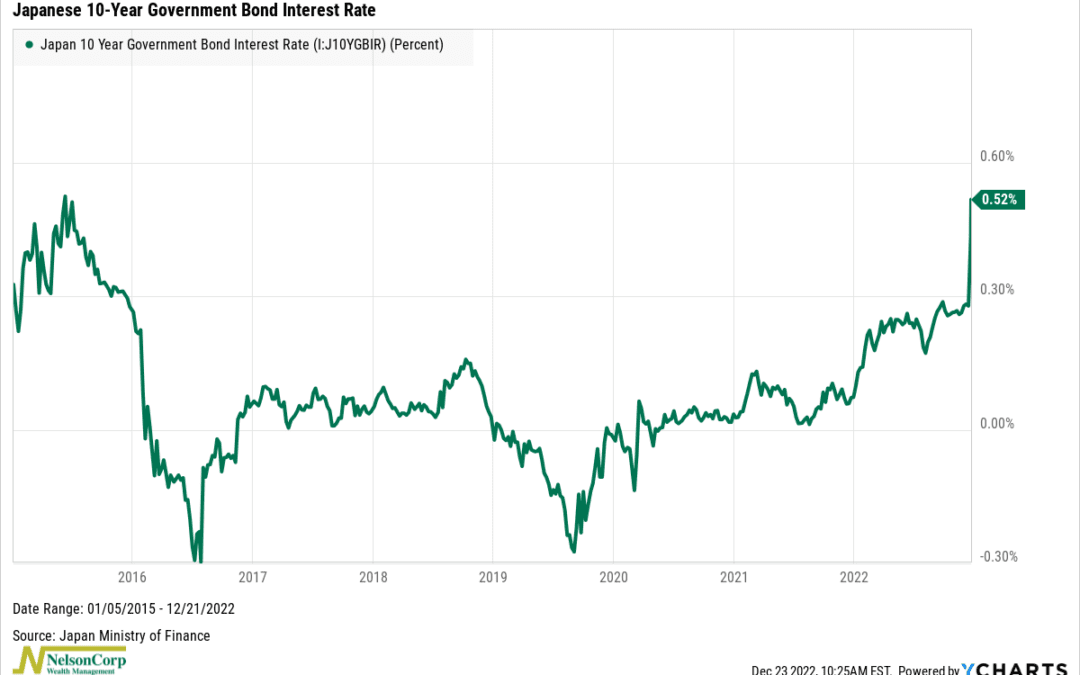
Japan’s central bank, the Bank of Japan, made quite a stir in the financial world this week when it announced that it is relaxing the allowed trading band for 10-year Japanese government bonds (known as JGBs) by 25 basis points. This means that, after keeping...
by NelsonCorp Wealth Management | Dec 22, 2022 | Indicator Insights
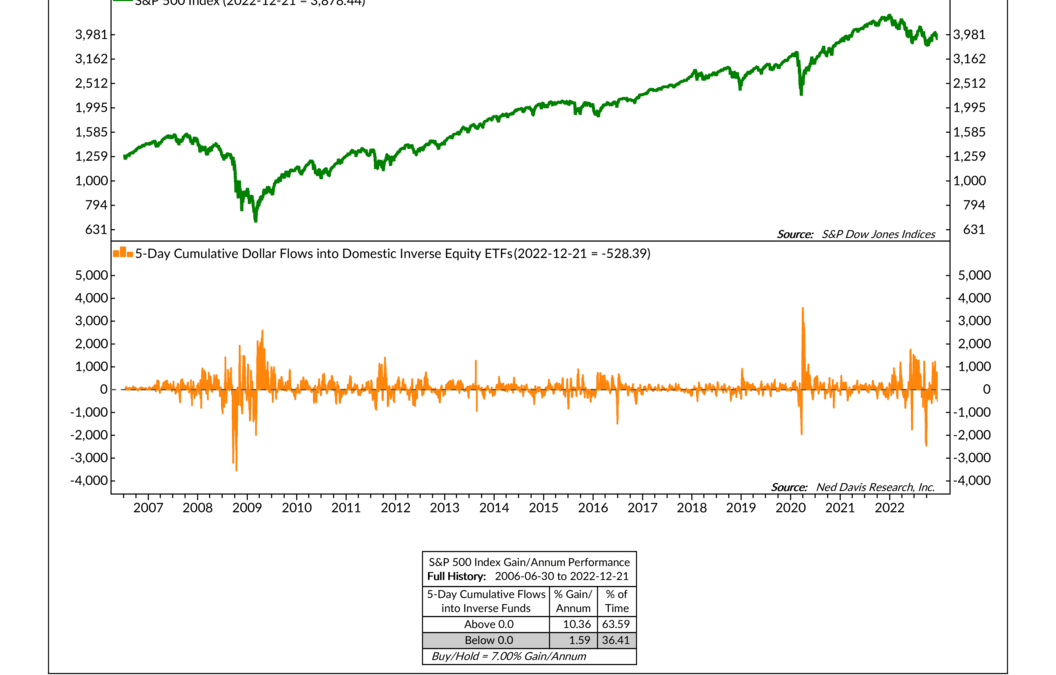
Usually, when people think about money flowing into the stock market, they associate it with positive returns. However, as this week’s featured indicator shows, that isn’t always the case for exchange-traded products (ETFs). Specifically, asset flows into...
