by NelsonCorp Wealth Management | Dec 19, 2022 | Weekly Market Thoughts
OVERVIEW Last week, the S&P 500, Dow Jones Industrial Average, and Nasdaq Composite all saw negative returns, with the Nasdaq experiencing the largest drop at -2.72%. The Dow fell -1.66%, and the S&P 500 decreased -2.08%. The VIX Index, which measures...
by NelsonCorp Wealth Management | Dec 16, 2022 | Chart of the Week
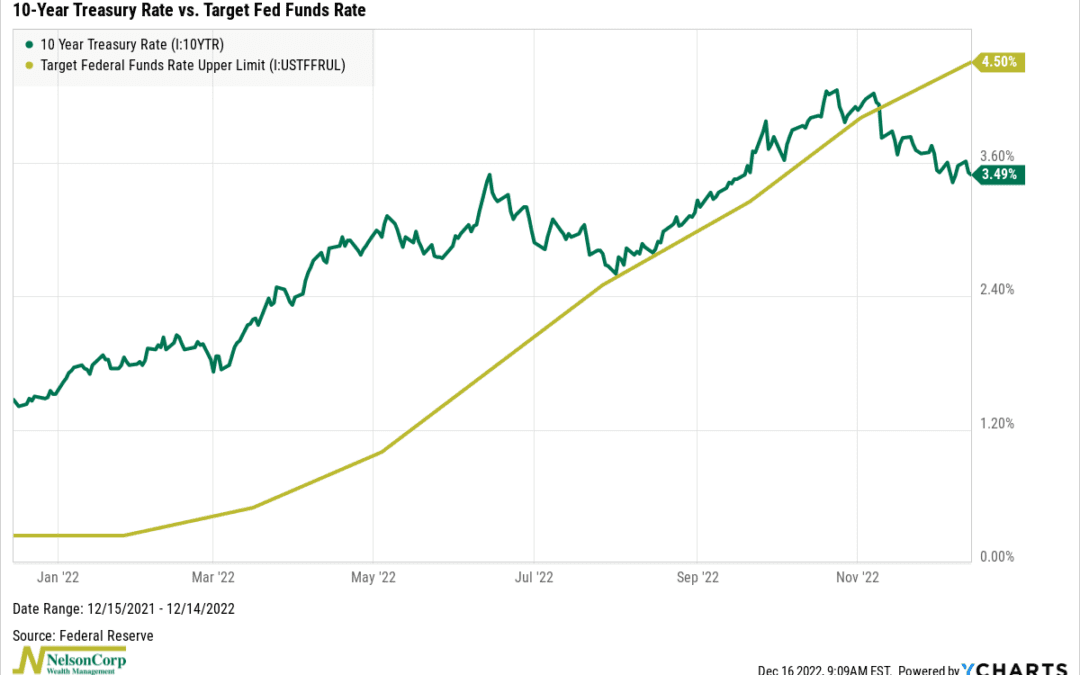
This week’s chart features two extremely important interest rates for the U.S. economy: the 10-year Treasury rate and the fed funds rate. The 10-year Treasury rate is a longer-term rate that the U.S. government charges on the money it borrows for ten years. By...
by NelsonCorp Wealth Management | Dec 15, 2022 | Indicator Insights
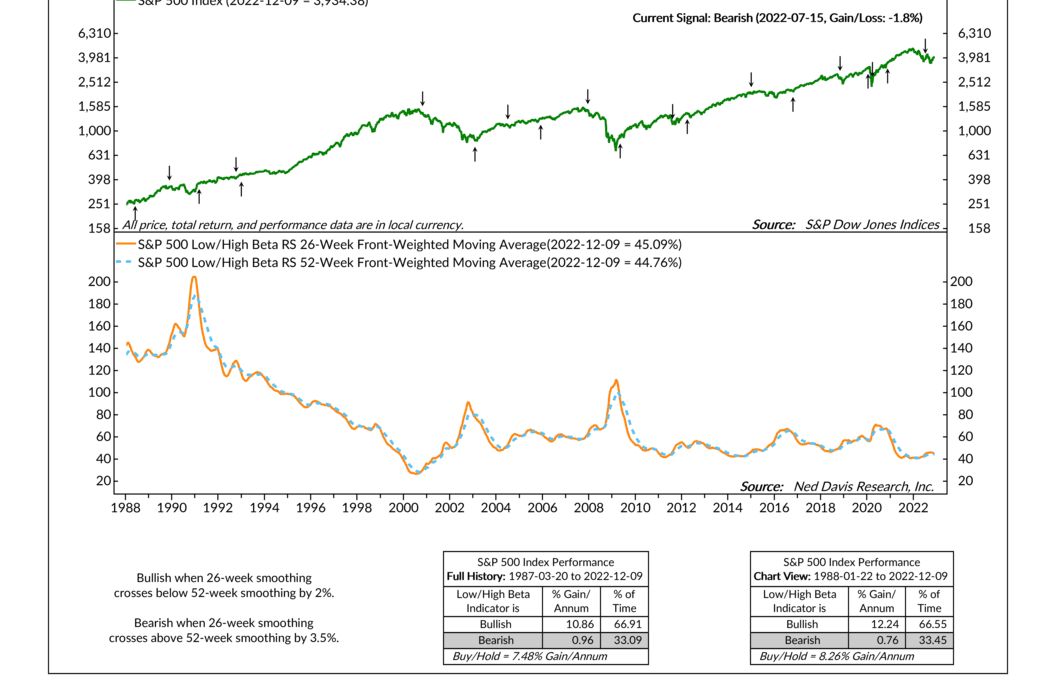
Relative strength is a powerful tool used to model stock market risk. It measures the performance of a security or group of securities to another group of securities to determine outperformance. For example, we like to look at the relative strength of low and...
by NelsonCorp Wealth Management | Dec 12, 2022 | Weekly Market Thoughts
OVERVIEW The U.S. stock market stumbled last week as volatility came rushing back to Wall Street. The S&P 500 Index slipped 3.4%, the Dow Jones Industrial Average fell 2.8%, and the Nasdaq Composite dropped 4%. Foreign stocks, however, were mixed. The MSCI...
by NelsonCorp Wealth Management | Dec 9, 2022 | Chart of the Week
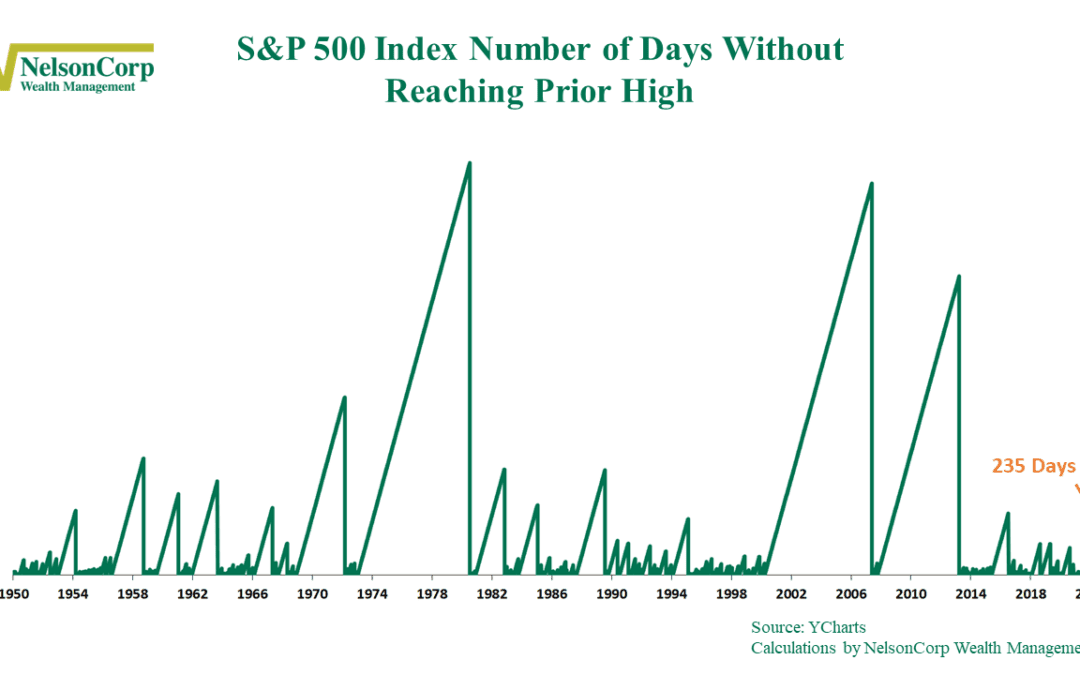
The S&P 500 Index is a popular stock market index often used to measure the overall health of the U.S. stock market. One way to gauge the strength of the market is to look at the number of days the index spends below its prior high. As I’ve pointed out on...
