by NelsonCorp Wealth Management | Oct 14, 2022 | Chart of the Week
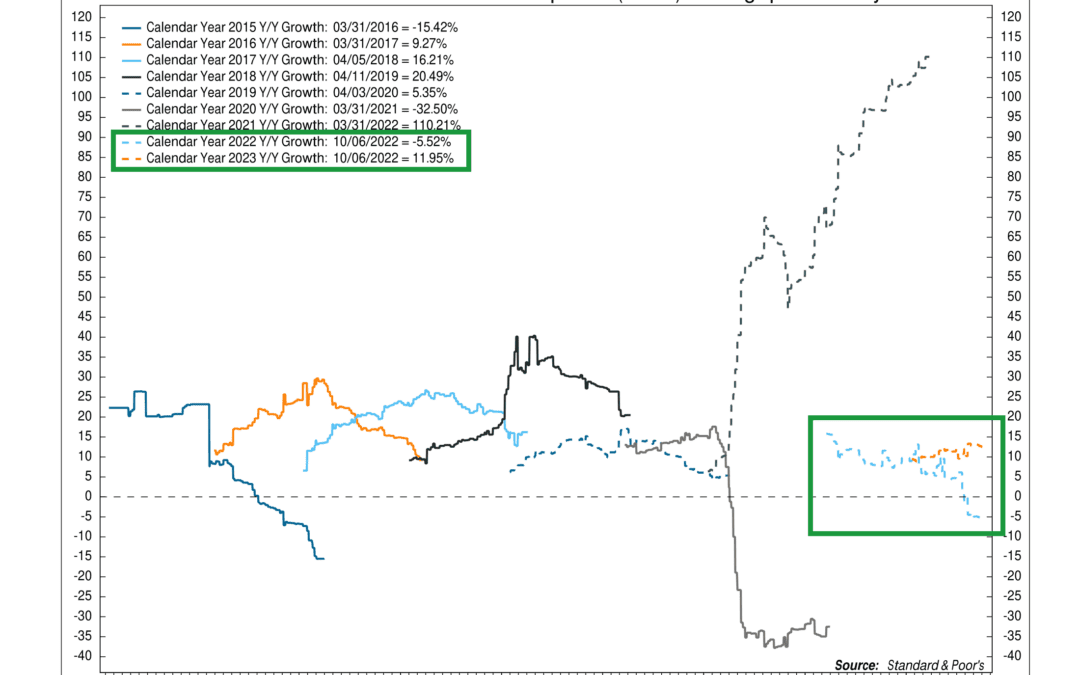
Third quarter earnings season is upon us. So, for this week’s featured chart, we show the consensus estimates for year-over-year growth in S&P 500 reported earnings per share by calendar year. The two lines I want to focus on are the light blue and orange...
by NelsonCorp Wealth Management | Oct 13, 2022 | Indicator Insights
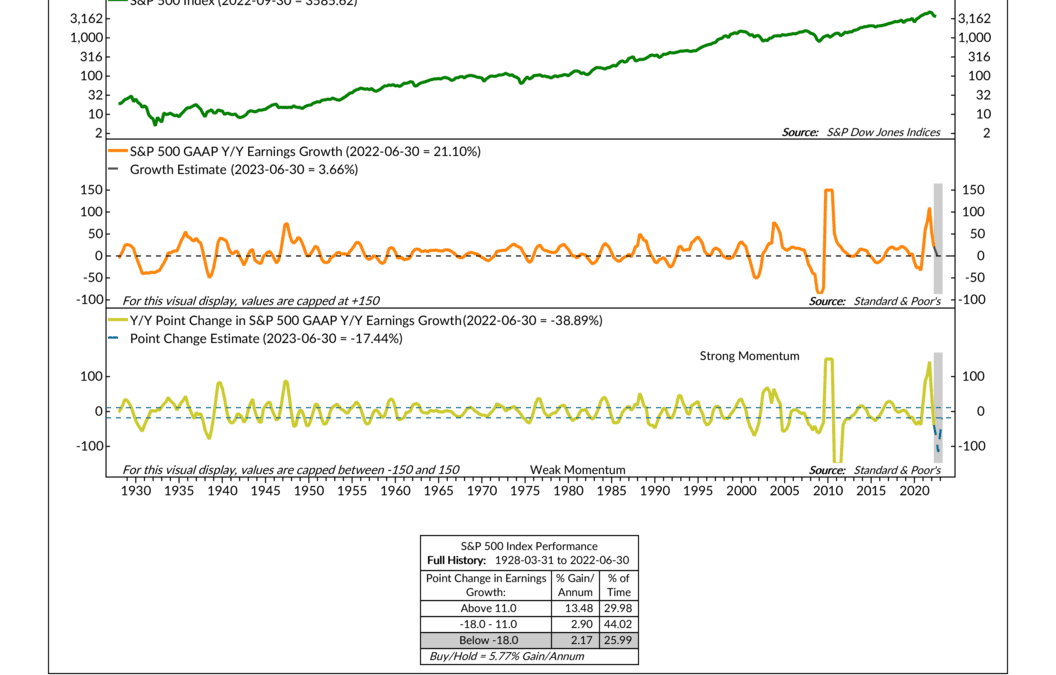
Earnings are an important driver of stock market returns. But the stock market is a complicated beast—it doesn’t just trade off earnings growth alone. The key insight of this week’s featured indicator is that the market trades off the change in the...
by NelsonCorp Wealth Management | Oct 10, 2022 | Weekly Market Thoughts
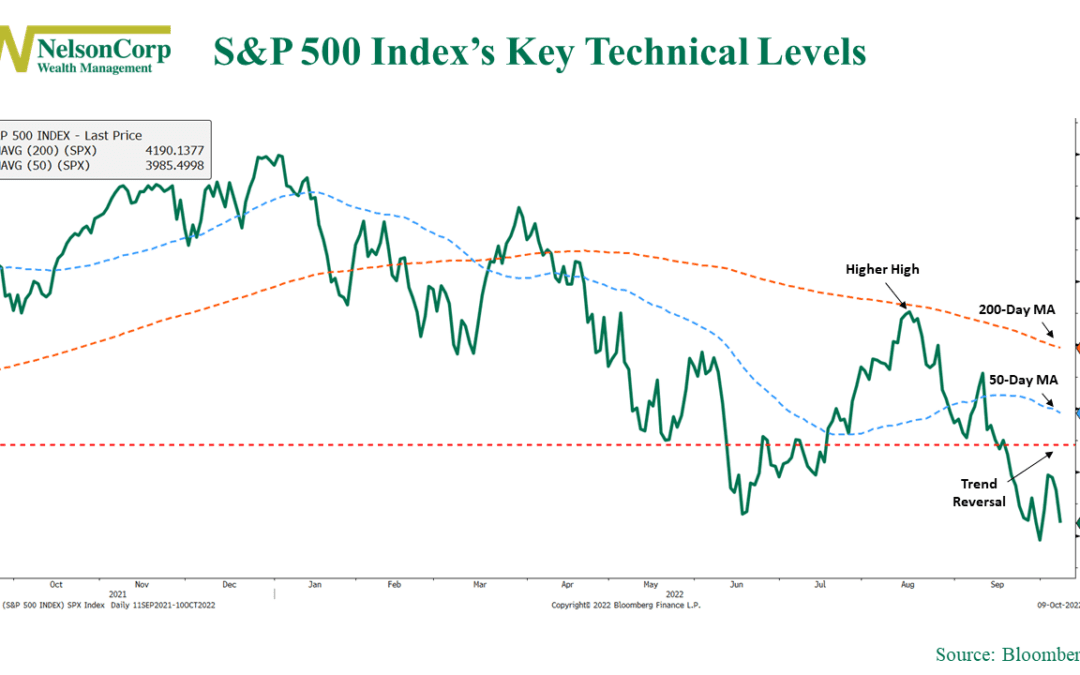
OVERVIEW Despite a volatile week, the major U.S. stock indices registered gains, snapping a three-week losing streak. The S&P 500 gained 1.5%, the Dow Jones Industrial Average rose 2%, and the Nasdaq Composite climbed 0.7%. Bonds were mixed, however. The...

by NelsonCorp Wealth Management | Oct 7, 2022 | Chart of the Week
For this week’s featured chart, we want to highlight a theme that’s dominated the stock market this year. It has to do with the Fed, its rate-hiking cycle, and how that affects stock market returns. The chart shows that, historically, the speed at which the Fed...

by NelsonCorp Wealth Management | Oct 6, 2022 | Indicator Insights
This week’s featured indicator looks at the stock market’s median price-to-earnings (P/E) ratio to measure valuation. For those unfamiliar, the P/E ratio is the price of a stock divided by its earnings per share. The higher the ratio, the more investors...
