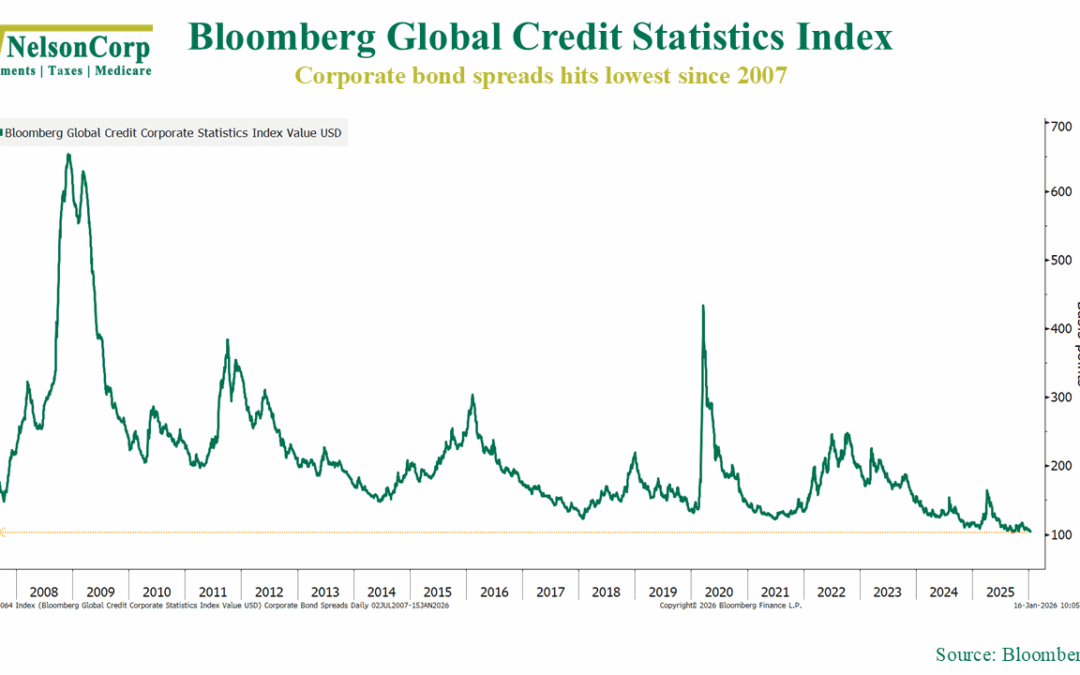
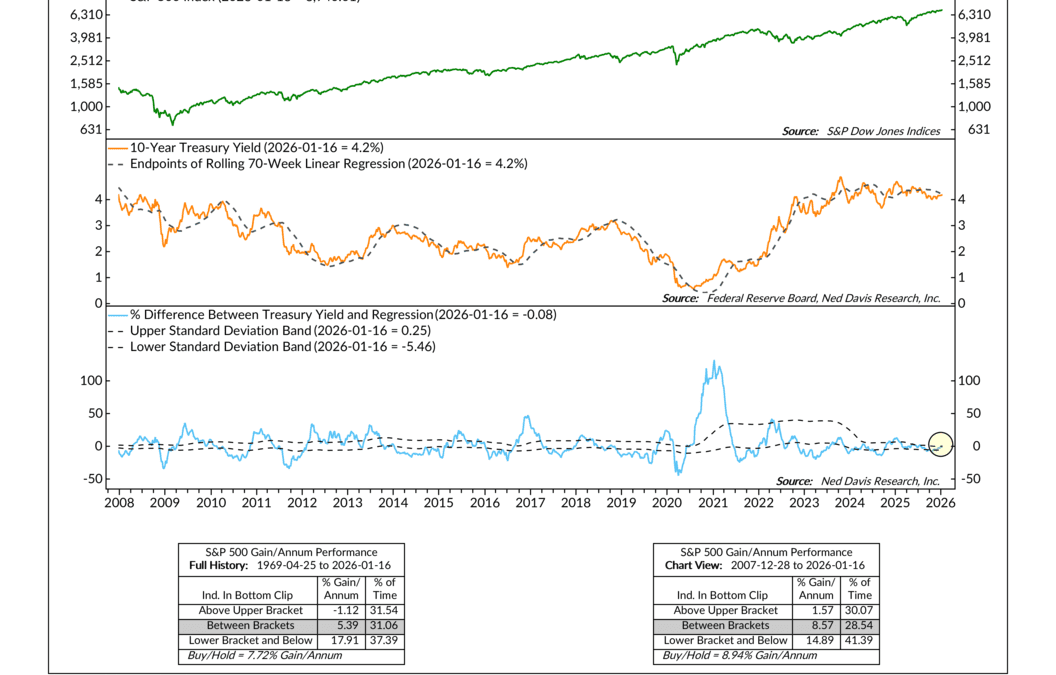
The Discount Rate
Interest rates are important for the stock market. In a technical sense, they’re what we call the “discount rate.” This is the rate at which the future cash flows generated by the companies in the stock market get discounted back to the present. Because of how...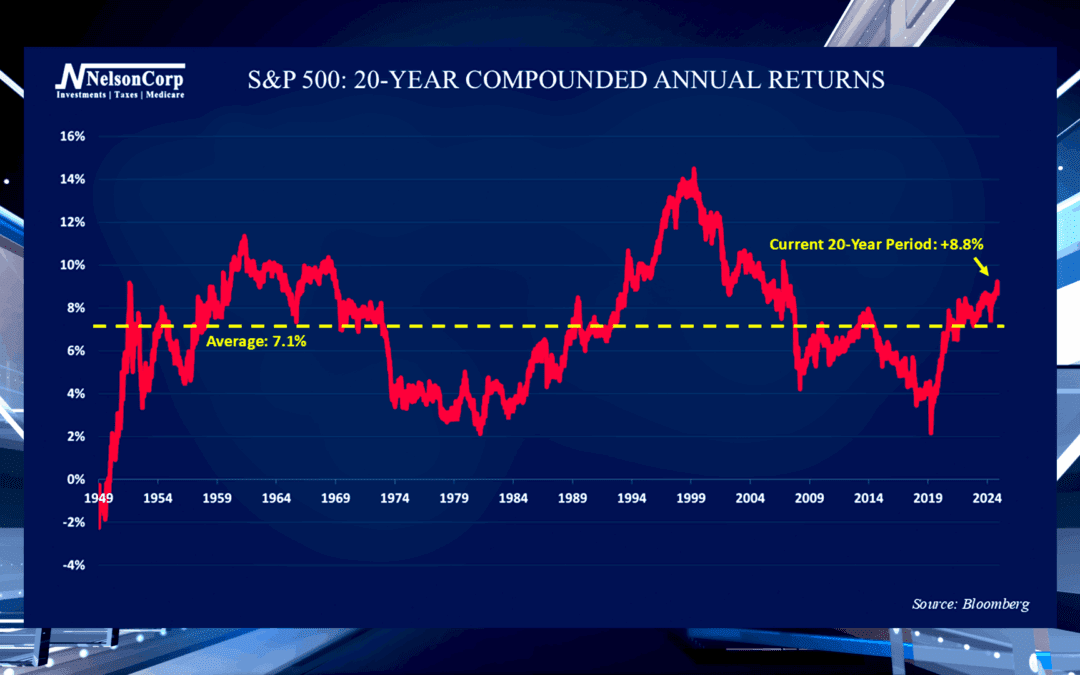
Long-Term Cycles
When investors evaluate long-term stock market returns, it is helpful to look through the lens of rolling 20-year periods. Nate Kreinbrink shares the history of S&P 500’s returns and where the index stands now.
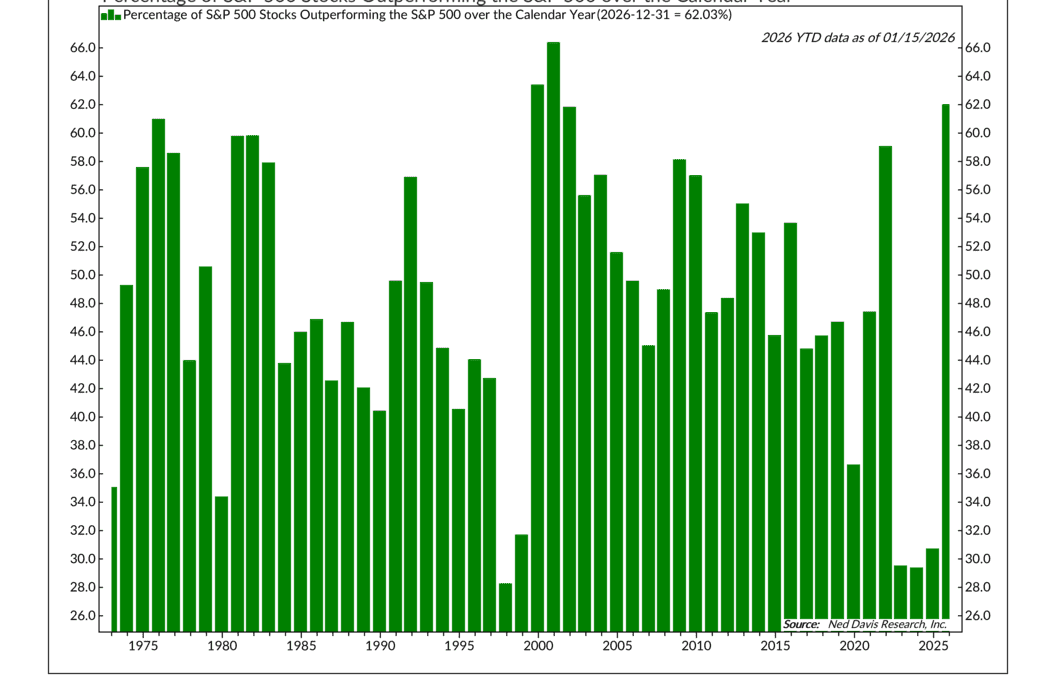
Deep Bench
OVERVIEW Markets pulled back modestly during the week, with mixed results across major asset classes. Large-cap U.S. equities were under mild pressure, as the S&P 500 declined 0.38% and the NASDAQ fell 0.66%. The Dow Jones Industrial Average slipped 0.29%,...