
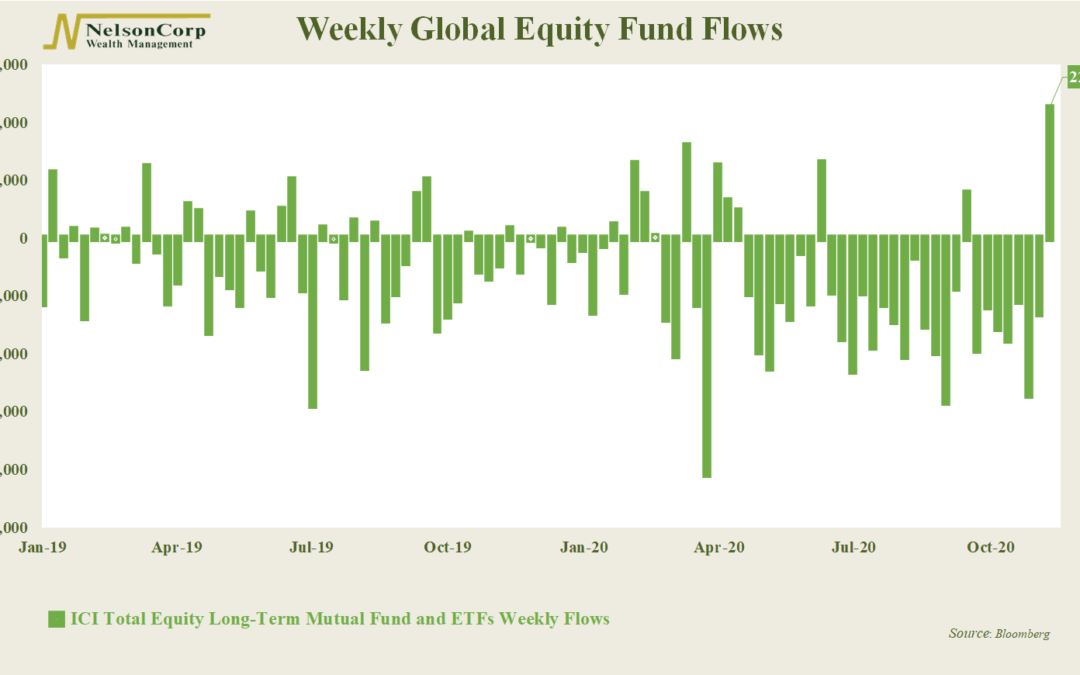
Chart of the Week: Fantastic Flows
This week’s chart looks at the amount of money flowing into global stock funds on a weekly basis, as compiled by the Investment Company Institute. For most of the year, money has been flowing out of stocks—to the tune of about $9.5 billion a week. However,...

Do Well By Doing Good
While there have been major swings both up and down this year in financial markets, there is one thing that has been trending in just one direction. John Nelson joins us to share that one thing and the factors that are analyzed when thinking about investments through this particular lens.

Financial Focus – November 18th, 2020
Listen to this week’s Financial Focus as Nate Kreinbrink and James Nelson discuss the volatility of the market, and the importance of sticking with a plan.

Your Friend the Fed
OVERVIEW In a reversal of what we're used to seeing this year, Big Tech got overshadowed by the smaller, more economically sensitive stocks. The tech-heavy Nasdaq fell about 0.6%, while the S&P 500 rose about 2.1%, and the Dow gained roughly 4%. The Russell...
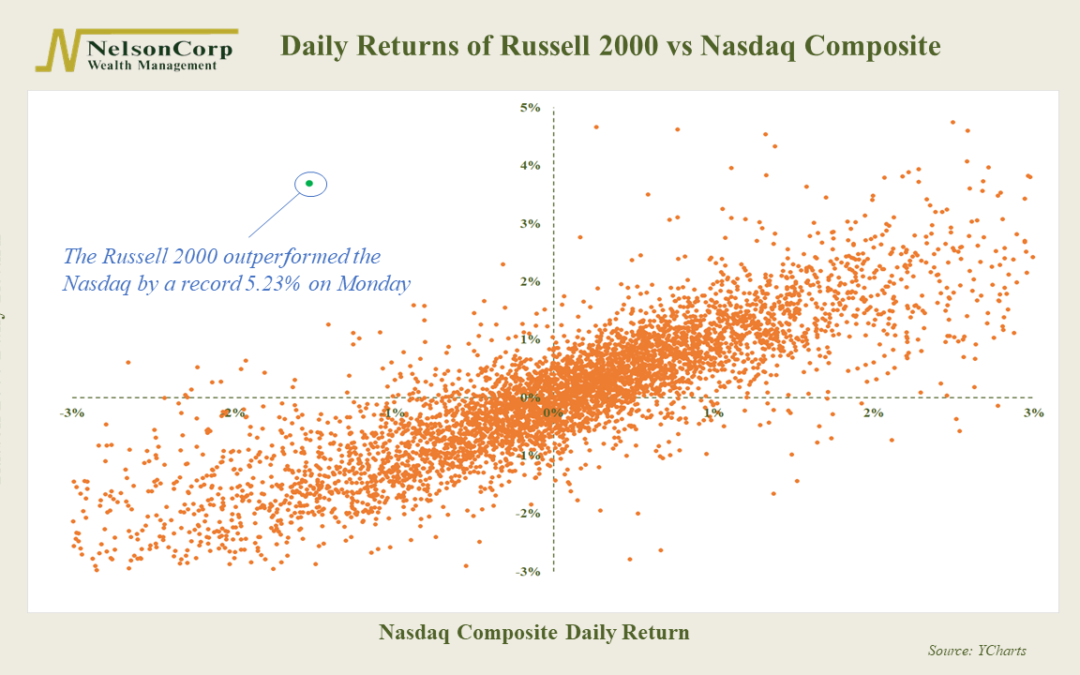
Chart of the Week: No Man’s Land
This week’s featured chart is a scatterplot of the daily returns of the Russell 2000 Index versus the Nasdaq Composite. These are two very different measures of the stock market. The Russell 2000 Index is comprised of the 2,000 smallest companies in the United...
Financial Focus – November 11th, 2020
Listen to this week’s Financial Focus as Nate Kreinbrink and James Nelson discuss the different parts that go into tax planning, and what you can do to benefit yourself now, and further down the road.

2020 Defined
David Nelson joins us to discuss what stands out as the defining characteristic of 2020 as we approach the end of a crazy year for financial markets.

Three’s Company
OVERVIEW The U.S. stock market rebounded aggressively last week. The S&P 500 gained 7.32%, the Dow rose 6.87%, and the tech-heavy Nasdaq surged a whopping 9.01%. The rally once again centered around large-cap growth stocks; in other words, the big tech...

Chart of the Week: Snapback
For this week’s chart, we show the weekly returns of the S&P 500 Index over the past three months. Each bar on the graph represents the total return of the stock index for that week. As expected, returns were quite volatile heading into the election. The...
Financial Focus – November 4th, 2020
Listen to this week’s Financial Focus as David Nelson and Gary Determan discuss the impact of the presidential election, and what it means for your retirement portfolio.

880 13th Avenue North
Clinton, Iowa 52732
563-242-9042
5465 Utica Ridge Road
Davenport, Iowa 52807
563-823-0532
9079 East Tamarack Drive
Dubuque, Iowa 52003
800-248-9042
info@nelsoncorp.com
Fax: 563-242-9062
Securities offered through Registered Representatives of Cambridge Investment Research, Inc., a broker-dealer, member FINRA/SIPC. Advisory services through Cambridge Investment Research Advisors, Inc., a Registered Investment Advisor. Cambridge and NelsonCorp Wealth Management are not affiliated. Financial Professionals may only conduct business with residents of the states or jurisdictions in which they are properly registered, licensed or exempt from registration and not all of the securities, products and services mentioned are available in every state or jurisdiction. Investing involves risk. Depending on the different types of investments there may be varying degrees of risk. Clients and prospective clients should be prepared to bear investment loss including loss of original principal.
Cambridge’s Form CRS (Customer Relationship Summary)
The information being provided is strictly as a courtesy. When you link to any of these websites provided herein, NelsonCorp Wealth Management makes no representation as to the completeness or accuracy of information provided at these sites. Nor is the company liable for any direct or indirect technical or system issues or any consequences arising out of your access to or your use of third-party technologies, sites, information, and programs made available through this site.