
Leading the Way
This week, I want to spotlight a research tool that does a great job of telling us where the stock market is likely headed next. It’s called the Leading Indicator Model. As the name implies, the model consists of 10 indicators with a history of leading the...

Big Mo
Big Mo, or “Big Momentum,” is an indicator we use to measure the trend and momentum of the stock market. It’s one of the best tools around for measuring the technical health of the broader equity market. It does this by combining over 100 component indicators...

More Testing Needed
OVERVIEW U.S. stocks were mixed last week. While the S&P 500 Index retreated 0.66% and the Dow Jones Industrial Average slipped 2.7%, the Nasdaq Composite rose 0.55%. Growth stocks led the way, gaining about 0.3%, whereas value-oriented stocks fell around...

Bond Bargain
Bond yields are finally looking more appealing. Our featured chart above shows that the yield on the Bloomberg U.S. Aggregate Bond Index—widely considered one of the best total bond market indices—has climbed to roughly 4.2%, its highest level in over a decade....

Trendsetter
For this week’s featured indicator, I’d like to revisit a tool we use to measure the long-term “trend” or direction of the stock market. It’s called a deviation-from-trend indicator. It gets this name because it looks at how the stock market is trending over...

Test Time
OVERVIEW U.S. stocks rose for a second straight week last week. The S&P 500 Index gained 2.67%, the Dow Jones Industrial Average rose 2%, and the tech-focused Nasdaq Composite surged 4.82%. Foreign stocks had a strong week as well. The MSCI EAFE Index of...
Wilting Wages
We’ve gotten some good news on the inflation front lately. The latest consumer price index release confirmed that inflation cooled for a sixth straight month. Additionally, last Friday’s employment report revealed a surprising decline in the year-over-year...
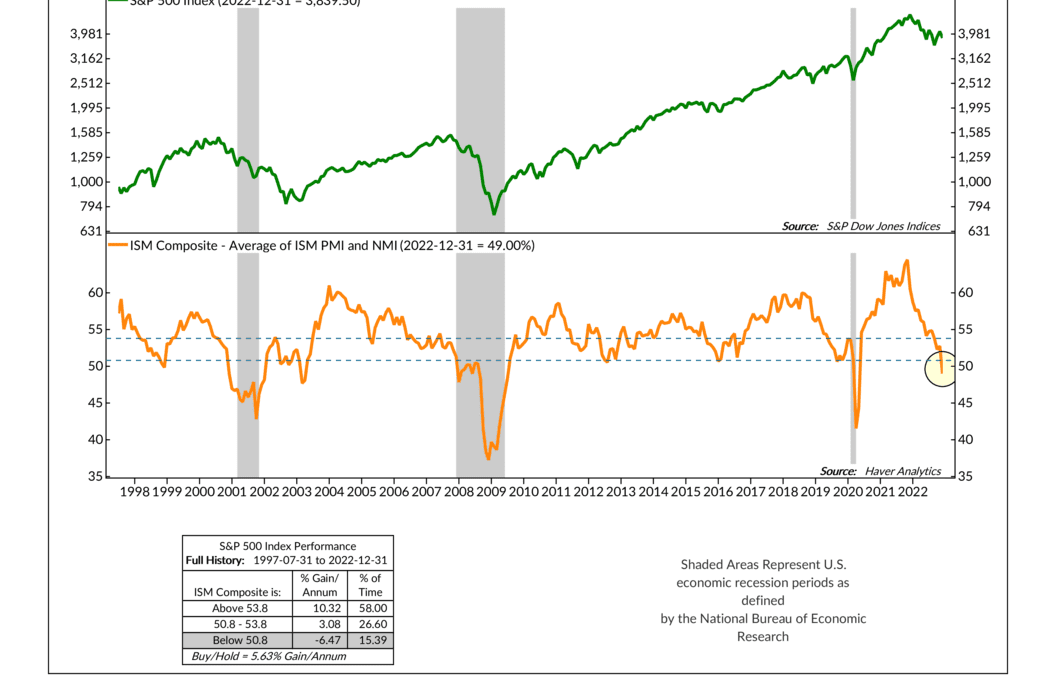
Talking to the Manager
For this week’s featured indicator, we explore the Purchasing Managers’ Index (PMI) and how it can be used to determine trends in the stock market. But first, what is the Purchasing Managers’ Index? Essentially, it’s a measure of the strength of the economy....
Competition
OVERVIEW U.S. stocks kicked off the new year on a positive note, with the S&P 500 climbing 1.4% last week. The Dow Jones Industrial Average rose 1.46%, and the Nasdaq Composite increased 0.98%. Foreign markets had an even better start to the year. The MSCI...
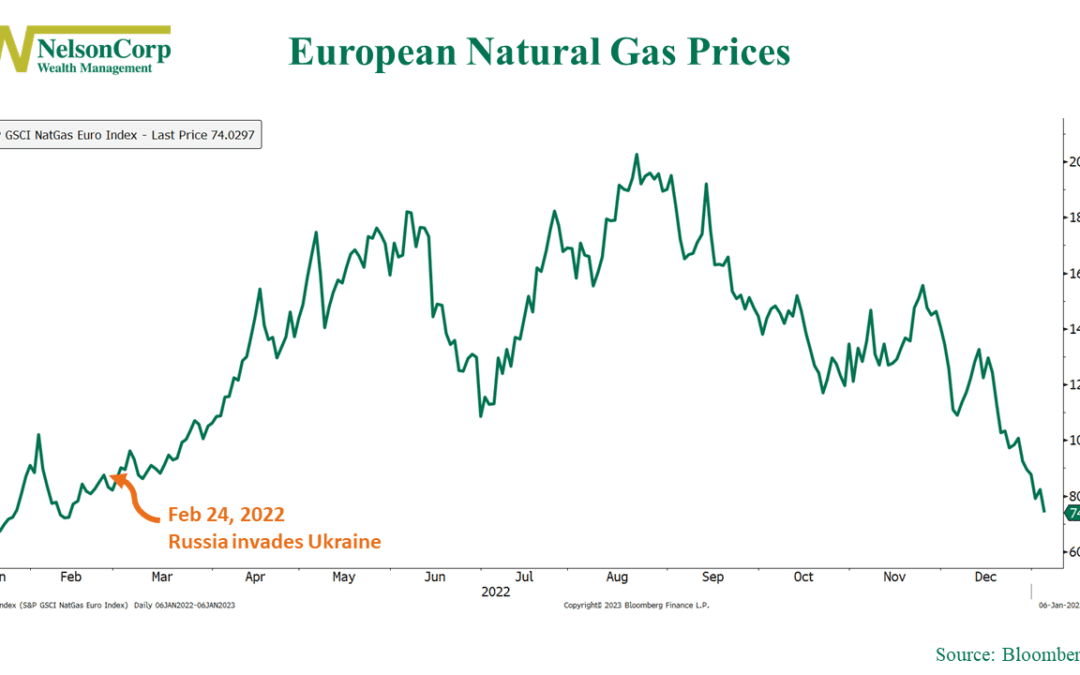
Energy Rollercoaster
2022 was a wild year. We witnessed a surge in global inflation unlike anything we had seen in decades, and various commodities saw significant price increases. One of those commodities was natural gas. As our chart of the week above shows, natural gas prices...

880 13th Avenue North
Clinton, Iowa 52732
563-242-9042
5465 Utica Ridge Road
Davenport, Iowa 52807
563-823-0532
9079 East Tamarack Drive
Dubuque, Iowa 52003
800-248-9042
info@nelsoncorp.com
Fax: 563-242-9062
Securities offered through Registered Representatives of Cambridge Investment Research, Inc., a broker-dealer, member FINRA/SIPC. Advisory services through Cambridge Investment Research Advisors, Inc., a Registered Investment Advisor. Cambridge and NelsonCorp Wealth Management are not affiliated. This communication is strictly intended for individuals residing in the states of AZ, AR, CA, CO, CT, FL, GA, IA, IL, IN, ME, MI, MN, MO, NC, NJ, NY, SD, TN, TX, UT, WI, and WY. No offers may be made or accepted from any resident outside the specific states referenced. Investing involves risk. Depending on the different types of investments there may be varying degrees of risk. Clients and prospective clients should be prepared to bear investment loss including loss of original principal.
Cambridge’s Form CRS (Customer Relationship Summary)
The information being provided is strictly as a courtesy. When you link to any of these websites provided herein, NelsonCorp Wealth Management makes no representation as to the completeness or accuracy of information provided at these sites. Nor is the company liable for any direct or indirect technical or system issues or any consequences arising out of your access to or your use of third-party technologies, sites, information, and programs made available through this site.