Revisiting the Low
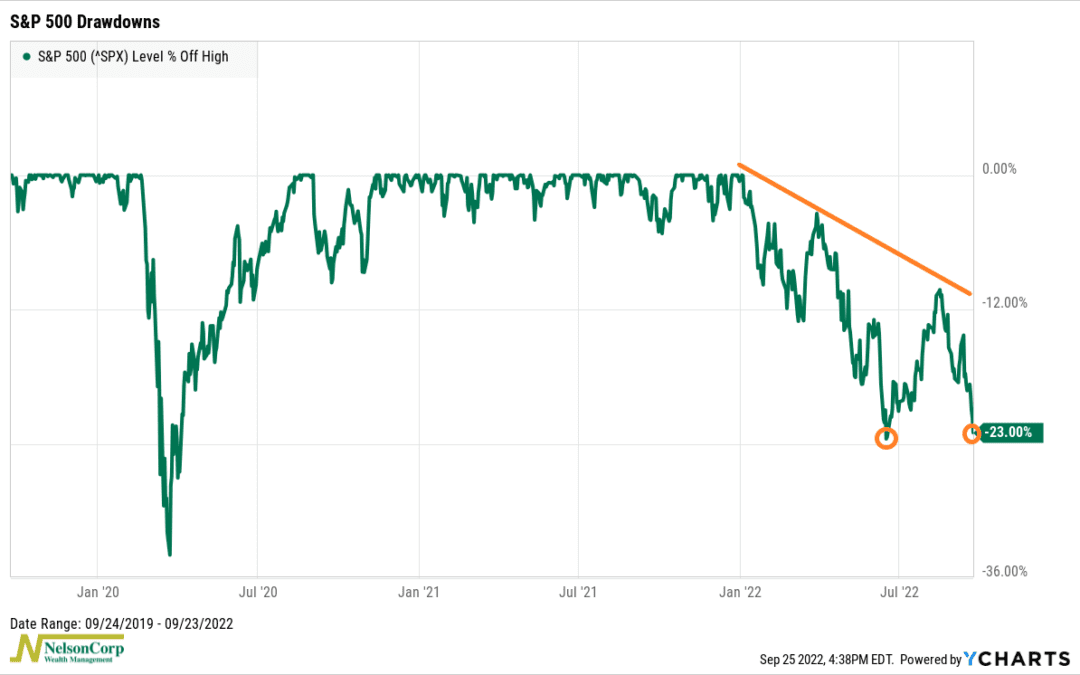
OVERVIEW The S&P 500 index reentered bear market territory last week with a 4.65% weekly decline. The Nasdaq Composite, down more than 30% this year, fell 5.07%, and the Dow Jones Industrial Average dropped 4%. Foreign stocks had a rough week as well....
Fun With the Fed
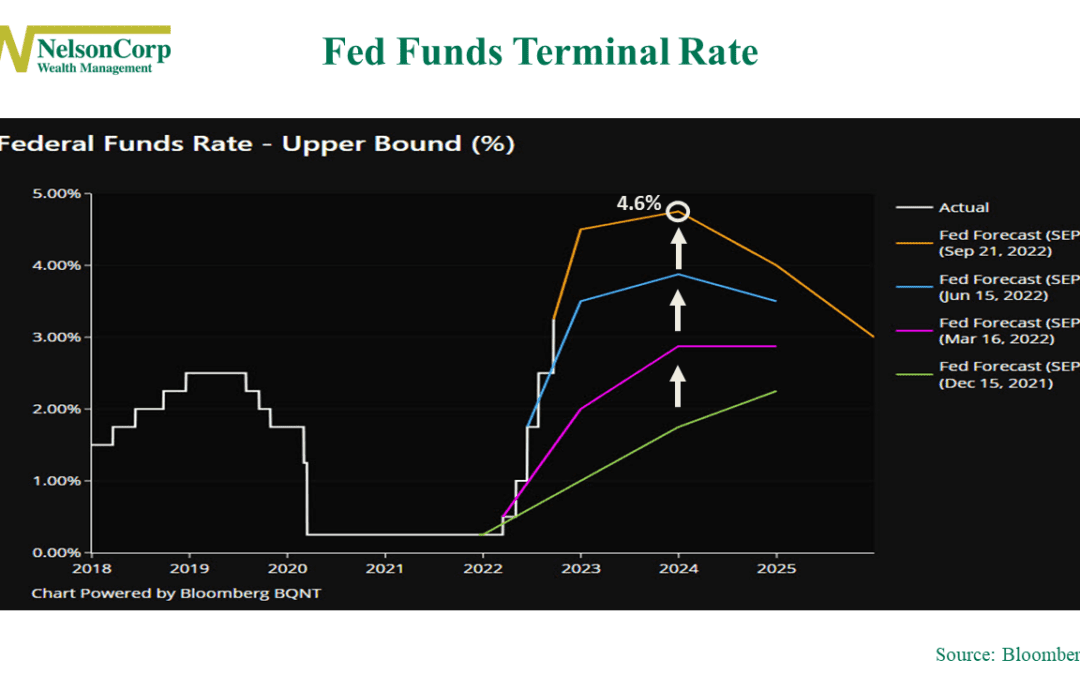
The Federal Reserve held its sixth FOMC meeting this week. One interesting thing to note from the meeting was that the Fed continued to raise its forecast for the fed funds terminal rate. Shown on the chart above, the terminal rate is the peak spot where the...
Recession Probability
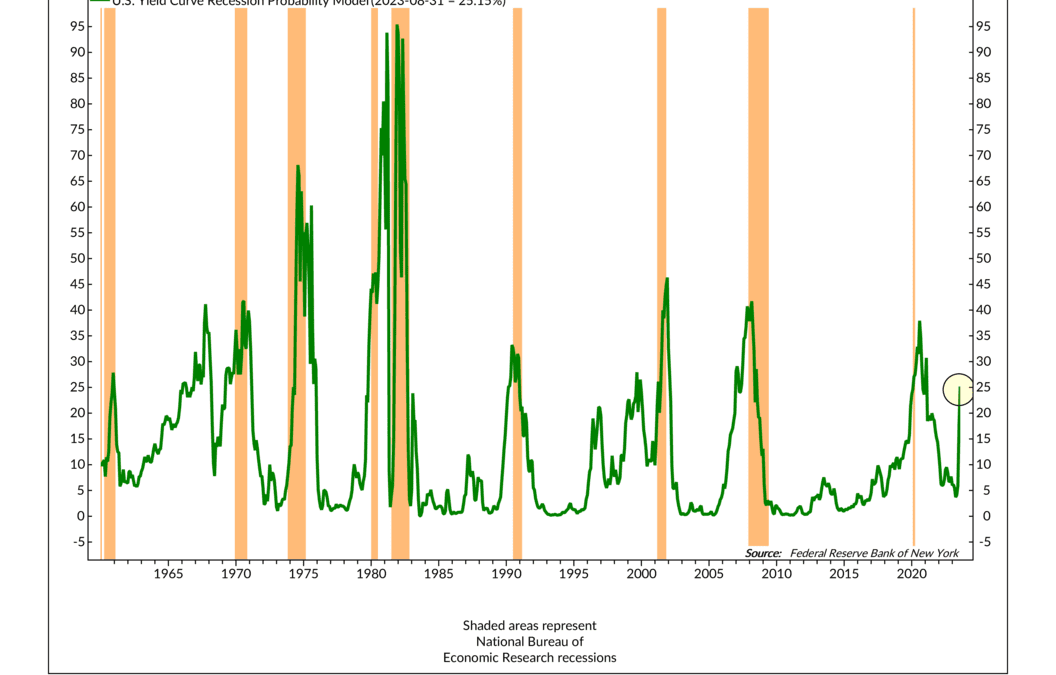
This week’s indicator looks at the yield curve and how its shape can be used to anticipate when an economic recession is becoming more likely. The portion of the yield curve that it focuses on is the 10-year Treasury rate and the 3-month Treasury rate. The New...

Looking for a Volatility Spike
OVERVIEW It was another rough week for the U.S. stock market. All three benchmark stock indices posted losses. The S&P 500 declined 4.8%, its worst week since mid-June. The Dow Jones Industrial Average lost 4.1%, and the Nasdaq Composite slid 5.5%....

Entrenched Inflation
Inflation has been a thorn in the side of the stock market all year. This week, we found out that the Consumer Price Index (CPI)—a commonly used measure of inflation—dropped to an 8.3% year-over-year rate in August versus the 8.52% rate in July and the 9.06%...

High but Falling Inflation
This week's featured indicator examines the relationship between stock performance and inflation in the U.S. The indicator uses two main inputs: the year-to-year change in the Consumer Price Index (CPI) and the six-month smoothing or average of the CPI....
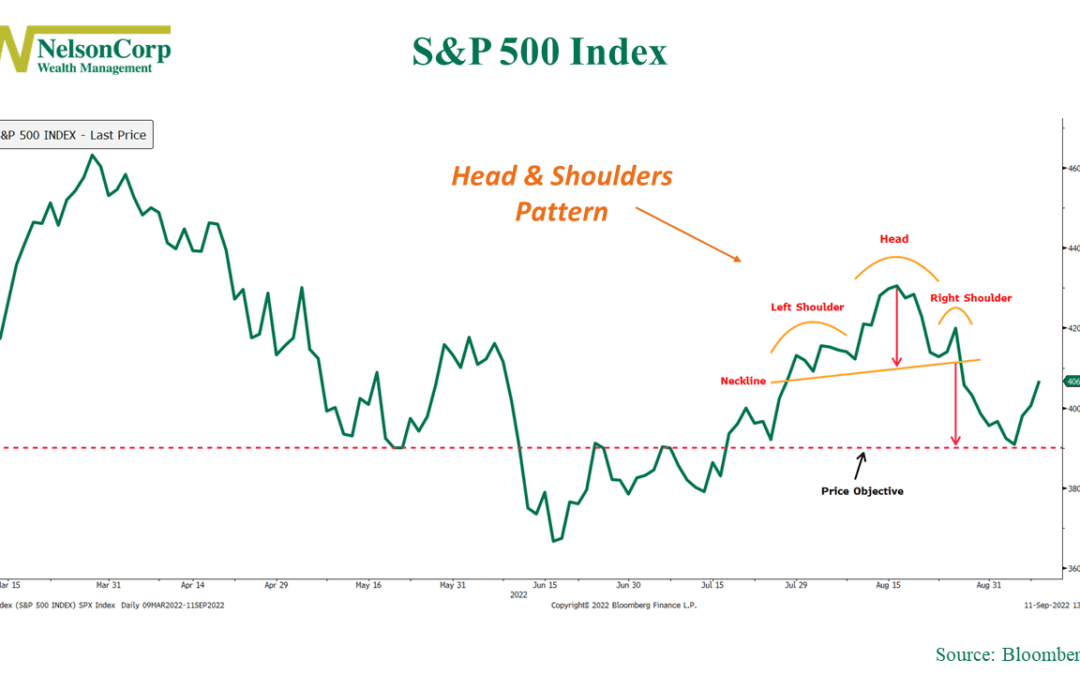
Head, Shoulders – Knees and Toes?
OVERVIEW The U.S. stock market snapped a three-week losing streak on a holiday-shortened week last week. The S&P 500 gained 3.65%, the Dow Jones Industrial Average rose 2.66%, and the Nasdaq Composite popped 4.14%. Growth stocks led the way, gaining 4.11%....
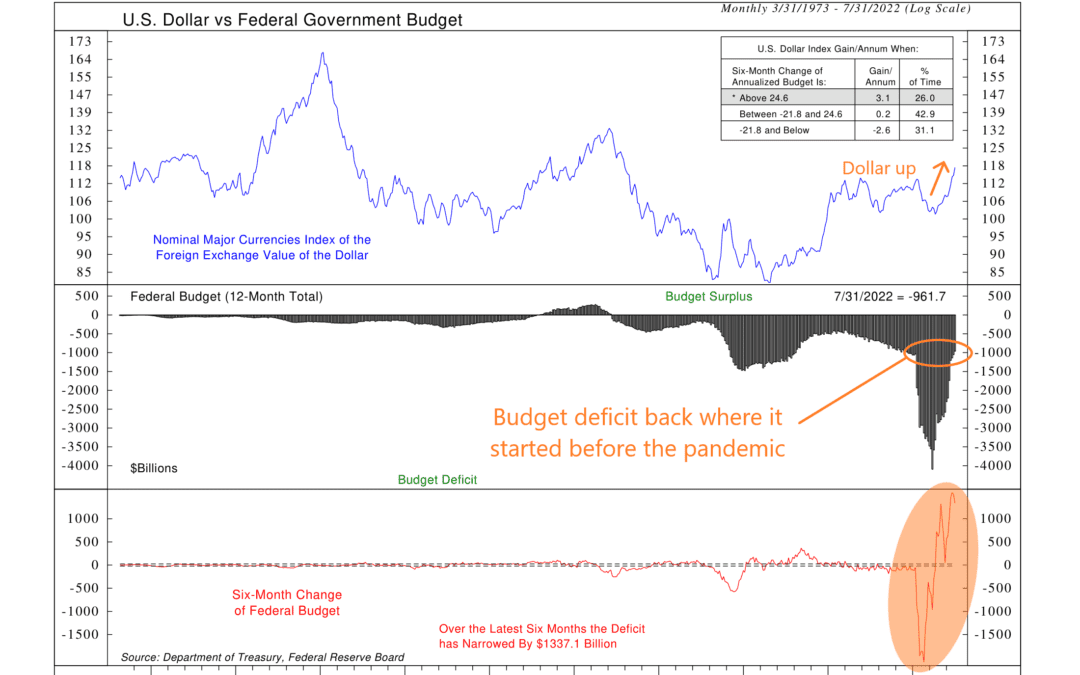
Belt Tightening
This week’s chart shows the change in the U.S. federal budget going back to 1973. In the middle clip, we have the rolling 12-month total federal budget, with positive values indicating a budget surplus and negative values indicating a budget deficit. The red...
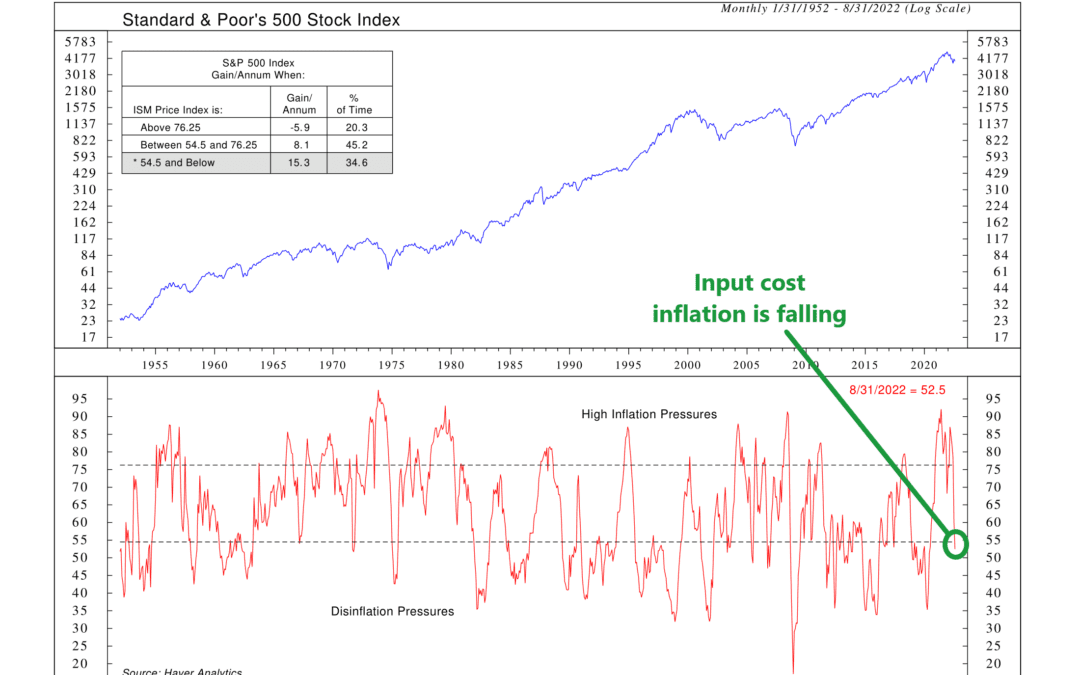
What the Manufacturers Pay
Every month, the Institute of Supply Management (ISM) conducts surveys of purchasing managers at hundreds of manufacturing firms in the U.S. and compiles the results into an index. Among the various sub-indices in the report is an index that measures the prices...
A Rude Awakening
OVERVIEW The U.S. stock market continued to sell off last week, with the S&P 500 falling 3.29%, the Dow Jones Industrial Average dropping 2.99%, and the Nasdaq Composite plunging 4.21%. Foreign stocks slipped up as well. Developed country stocks fell 3.13%,...

880 13th Avenue North
Clinton, Iowa 52732
563-242-9042
5465 Utica Ridge Road
Davenport, Iowa 52807
563-823-0532
9079 East Tamarack Drive
Dubuque, Iowa 52003
800-248-9042
info@nelsoncorp.com
Fax: 563-242-9062
Securities offered through Registered Representatives of Cambridge Investment Research, Inc., a broker-dealer, member FINRA/SIPC. Advisory services through Cambridge Investment Research Advisors, Inc., a Registered Investment Advisor. Cambridge and NelsonCorp Wealth Management are not affiliated. This communication is strictly intended for individuals residing in the states of AZ, AR, CA, CO, CT, FL, GA, IA, IL, IN, ME, MI, MN, MO, NC, NJ, NY, SD, TN, TX, UT, WI, and WY. No offers may be made or accepted from any resident outside the specific states referenced. Investing involves risk. Depending on the different types of investments there may be varying degrees of risk. Clients and prospective clients should be prepared to bear investment loss including loss of original principal.
Cambridge’s Form CRS (Customer Relationship Summary)
The information being provided is strictly as a courtesy. When you link to any of these websites provided herein, NelsonCorp Wealth Management makes no representation as to the completeness or accuracy of information provided at these sites. Nor is the company liable for any direct or indirect technical or system issues or any consequences arising out of your access to or your use of third-party technologies, sites, information, and programs made available through this site.