by NelsonCorp Wealth Management | Jul 26, 2024 | Chart of the Week
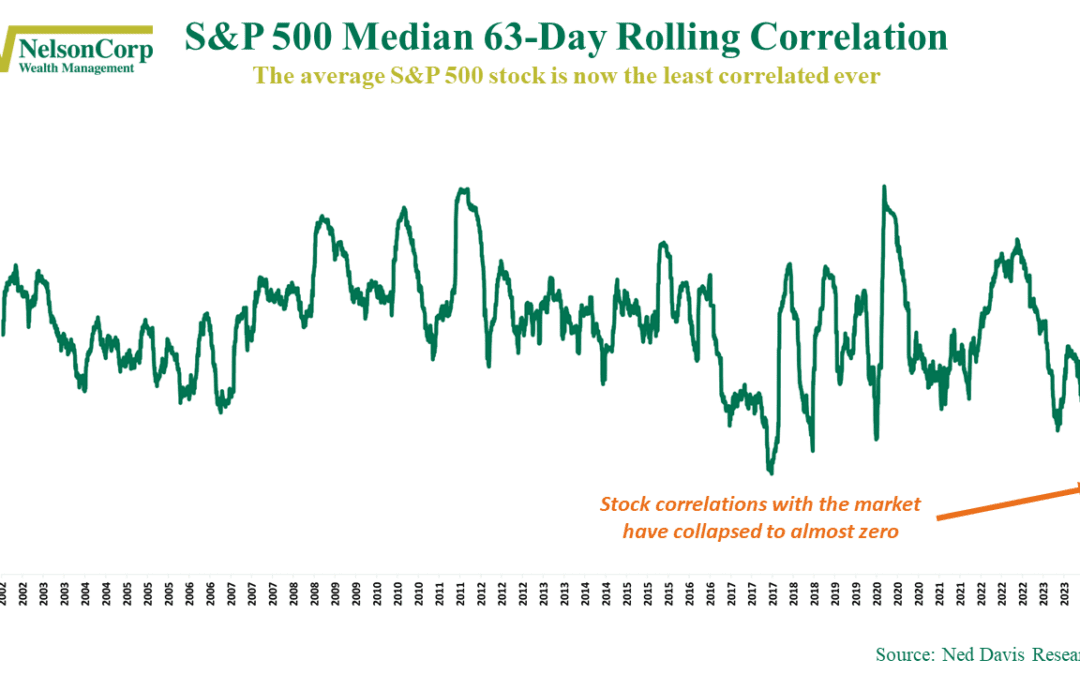
Gone are the days when stocks move in lockstep with the index. This week’s chart shows that stocks in the S&P 500 are increasingly going their own way. Specifically, the chart shows the median 63-day correlation of S&P 500 stocks to the S&P...
by NelsonCorp Wealth Management | Jul 19, 2024 | Chart of the Week
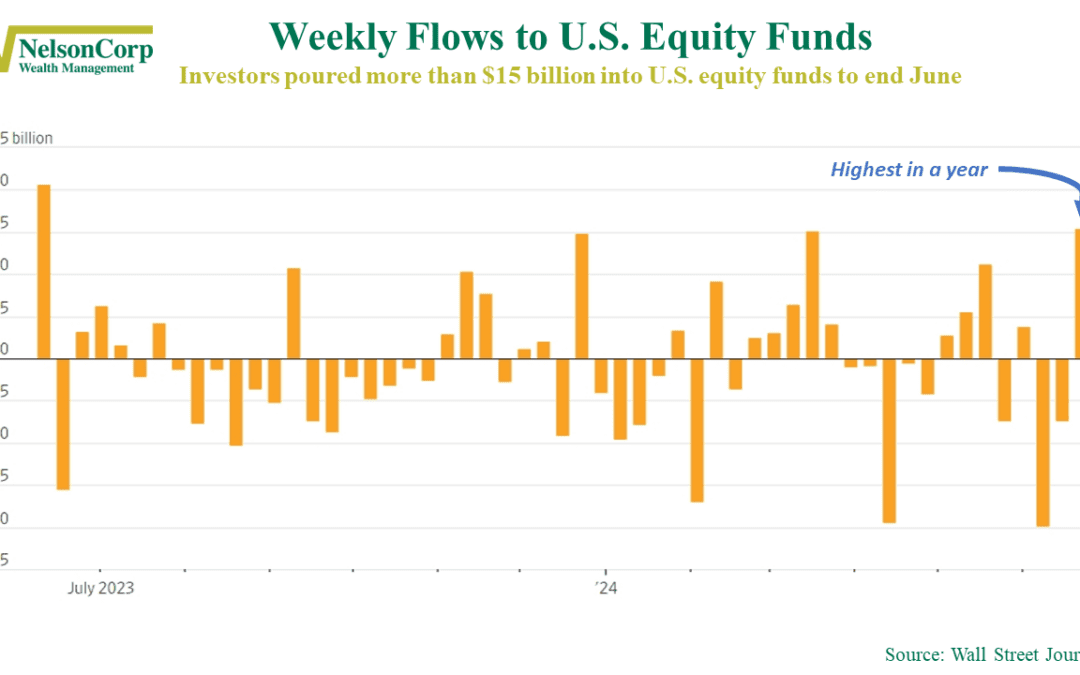
Investors are gobbling up stocks at a frenzied pace. As our featured chart this week illustrates, in the last week of June, $15 billion flowed into U.S. equity funds—the highest weekly amount in a year! This surge reflects growing confidence in a stock market...
by NelsonCorp Wealth Management | Jul 12, 2024 | Chart of the Week
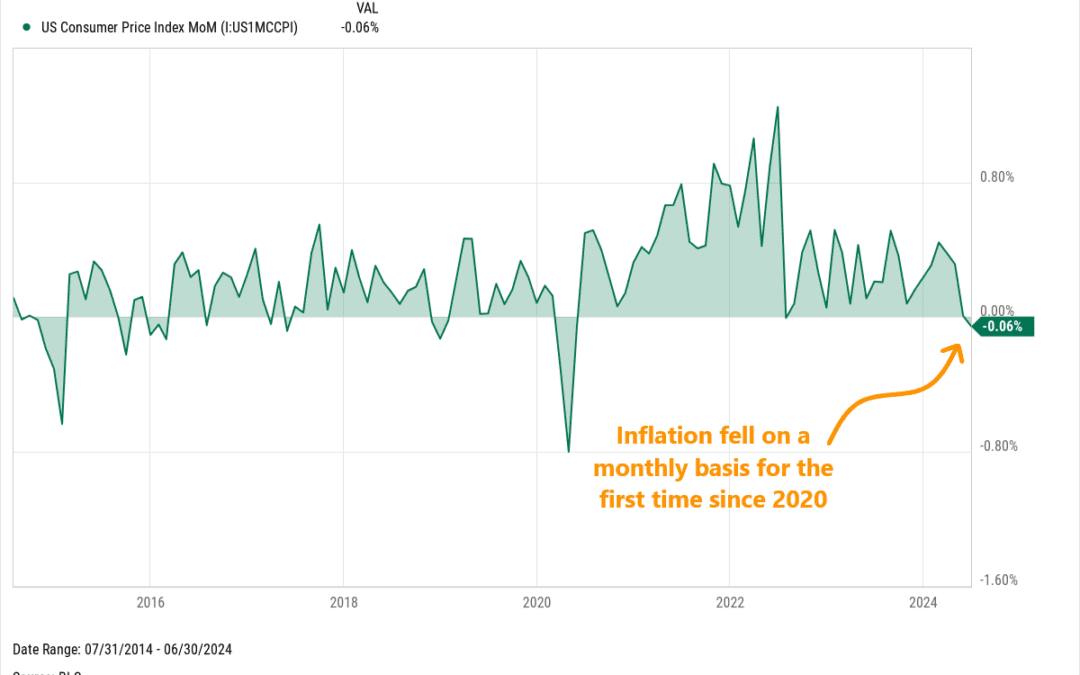
We got some big news regarding the economy this week. The latest inflation reading showed that June’s Consumer Price Index (CPI) fell 0.6% over the previous month. This was the first monthly decline since 2020. What caused the price drop? Used cars, mostly....
by NelsonCorp Wealth Management | Jul 5, 2024 | Chart of the Week
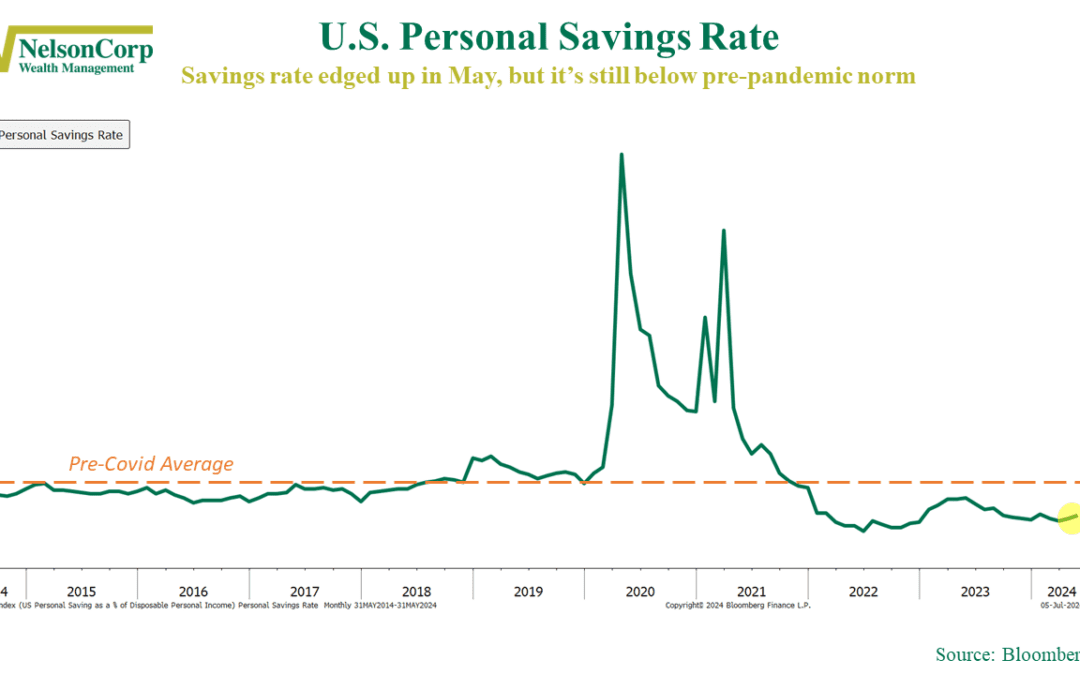
The latest savings rate data showed that the personal savings rate for U.S. households edged up to about 3.9% in May. On the bright side, this shows that Americans haven’t felt the need to cut back on spending in recent months and are actually socking away a...
by NelsonCorp Wealth Management | Jun 28, 2024 | Chart of the Week
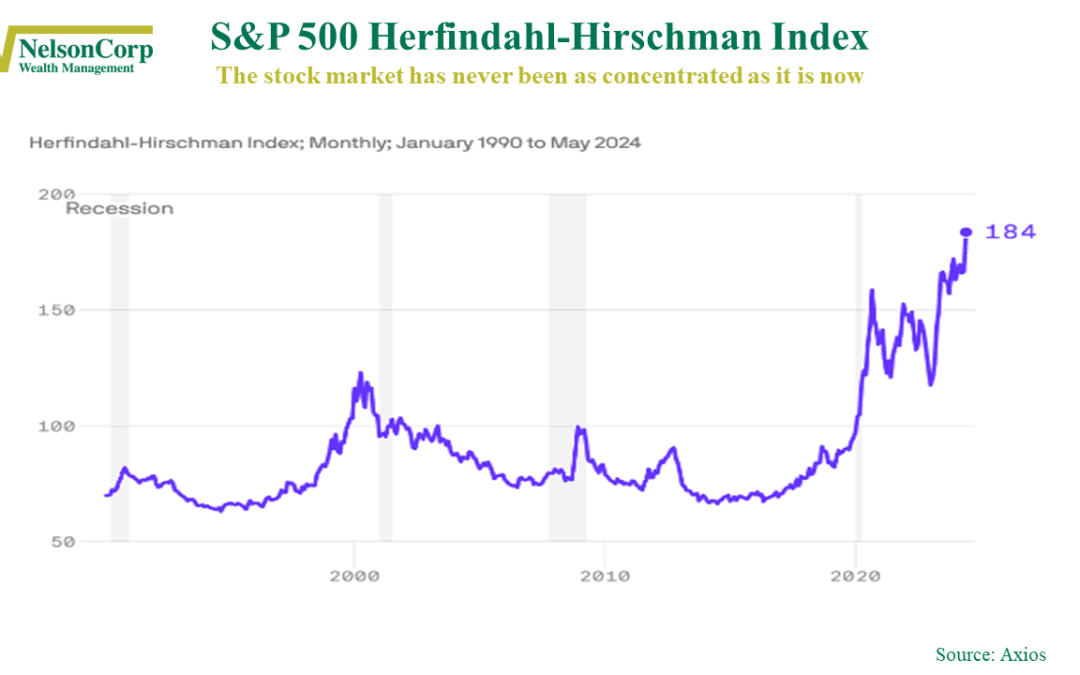
My daughter loves strawberry milk, but when she makes it, she uses way too much strawberry syrup. You can barely taste the milk because it’s so concentrated. It kind of reminds me of today’s stock market. But instead of syrup, a few giant companies dominate the...
by NelsonCorp Wealth Management | Jun 21, 2024 | Chart of the Week
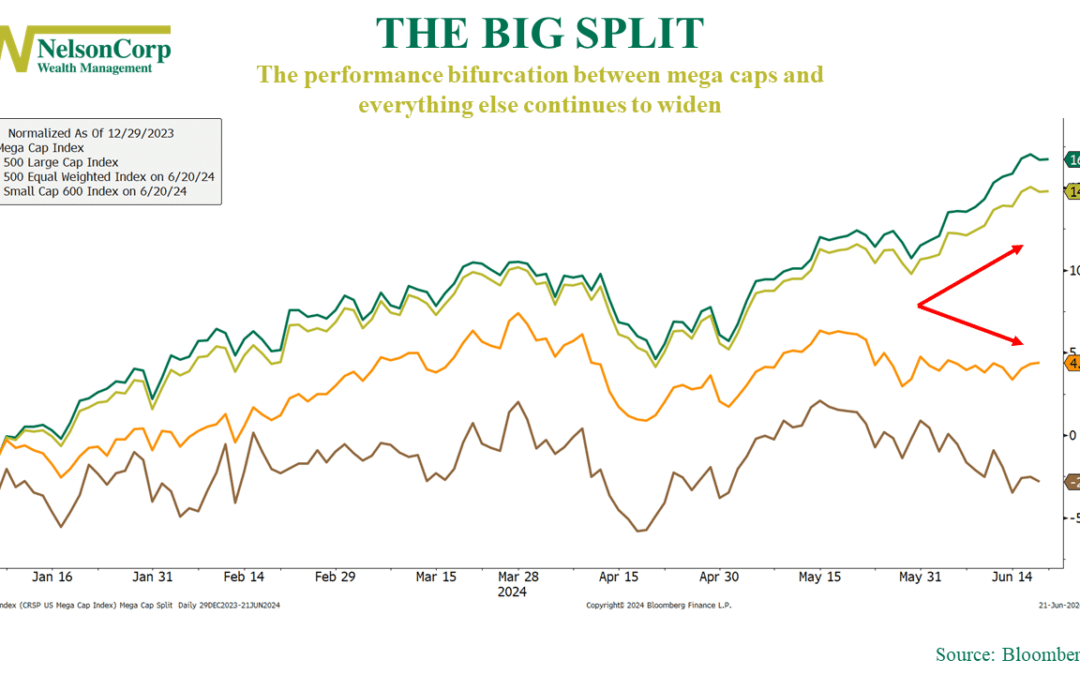
There’s a growing divide in the United States. No, I’m not talking about the Grand Canyon in Arizona. Or politics. But rather Wall Street, in the stock market, and it’s being driven by mega-cap stocks. This week’s featured chart highlights the performance of...
