
by NelsonCorp Wealth Management | Jan 5, 2024 | Chart of the Week
The bond market went on a rollercoaster ride in 2023. But, despite the wild gyrations, the 10-year Treasury rate ended the year exactly where it began. As you can see on the chart above, the 10-year Treasury rate—the benchmark U.S. interest rate—fell to a low...

by NelsonCorp Wealth Management | Dec 29, 2023 | Chart of the Week
As I write this, the major U.S. stock indices are inching toward new all-time highs. On a total return basis (including dividends), the Dow and the S&P 500 are already there—the tech-heavy Nasdaq is right behind them. But for this week’s chart, I want to...
by NelsonCorp Wealth Management | Dec 22, 2023 | Chart of the Week
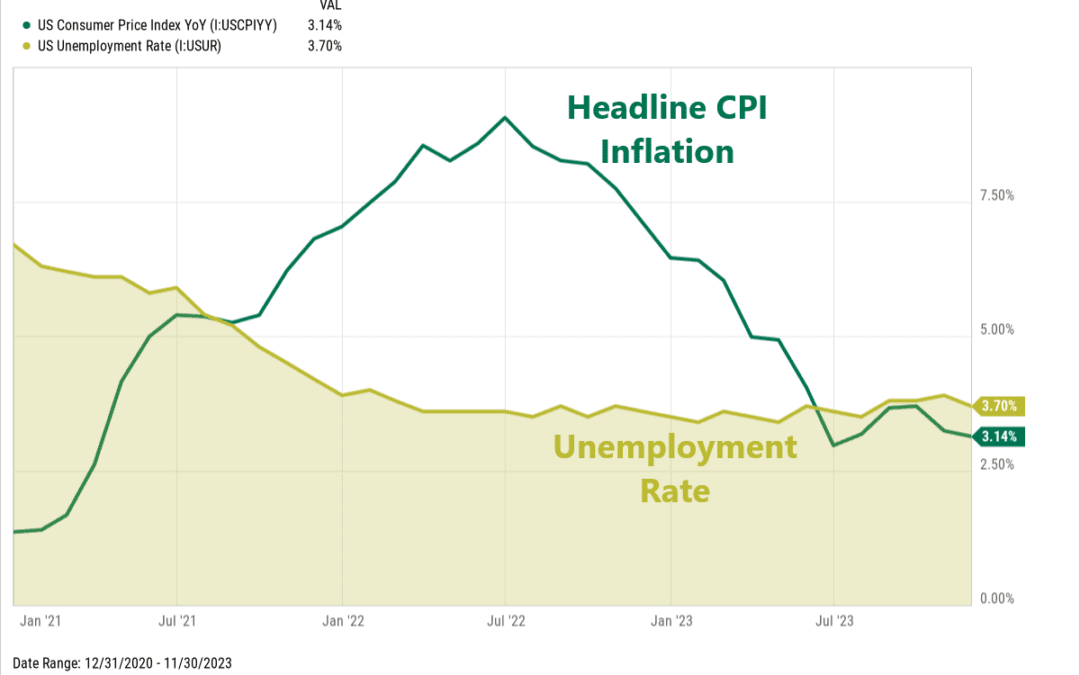
When the Federal Reserve began increasing interest rates in 2022, the big worry was that it would put a lot of people out of work. Initially, the Fed predicted that the unemployment rate would need to rise from 3.7% to 4.4% in 2023, equivalent to 1.2 million...
by NelsonCorp Wealth Management | Dec 15, 2023 | Chart of the Week
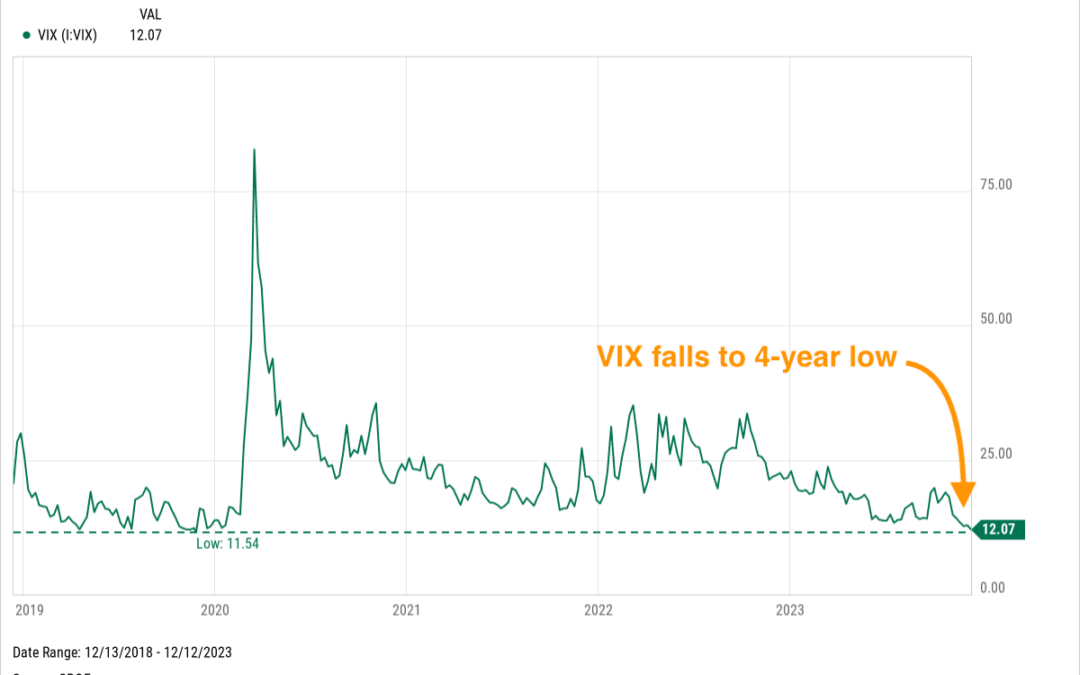
For this week’s chart, we highlight the VIX. No… not that ointment your mom rubbed on your chest when you were sick as a kid. But rather the VIX Index, a measure of market expectations for future stock market volatility. When the VIX is high, it means traders...
by NelsonCorp Wealth Management | Dec 8, 2023 | Chart of the Week
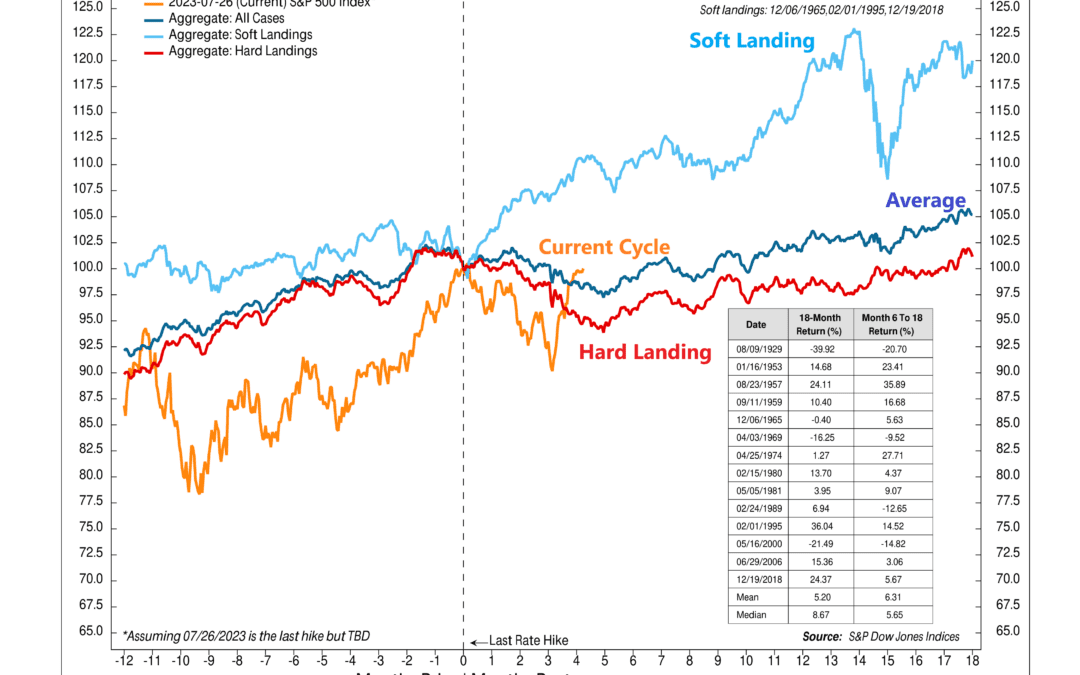
Has the Fed reached the summit of its rate-hiking adventure? If so, our featured chart this week might shed some light on where the stock market could be headed next. The chart illustrates the historical performance of the S&P 500 stock index after the...

by NelsonCorp Wealth Management | Dec 1, 2023 | Chart of the Week
Last year, the Federal Reserve geared up in its battle against inflation by swiftly increasing interest rates. They threw a powerful right hook at inflation, delivered in the form of 8% mortgage rates. The impact? A direct hit on the housing market, leaving it...
