by NelsonCorp Wealth Management | Jul 21, 2023 | Chart of the Week
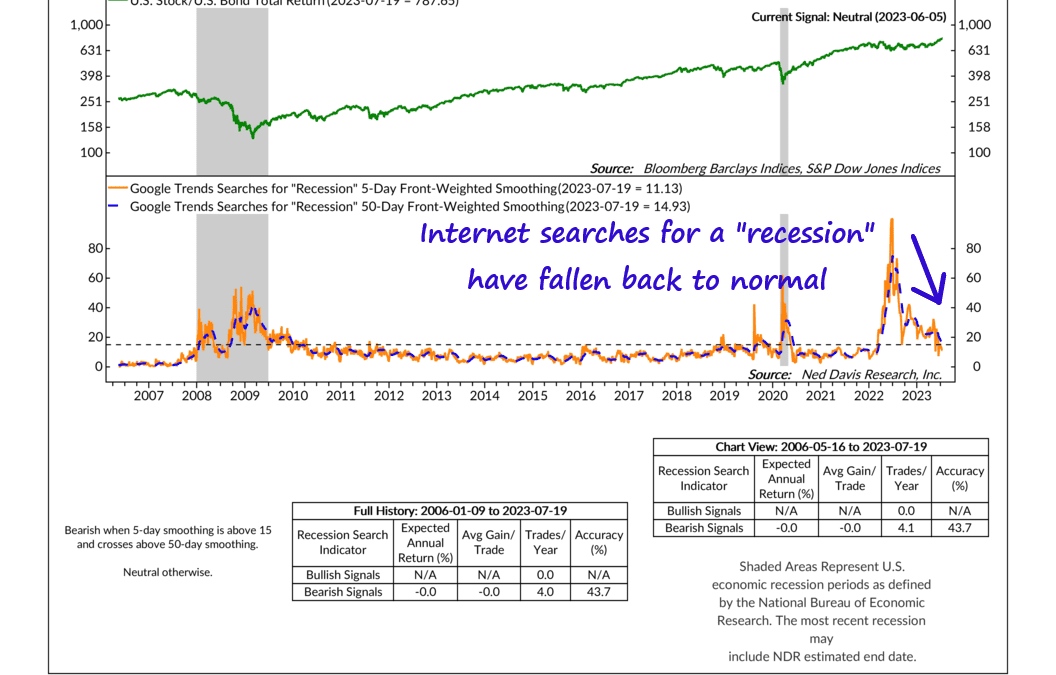
Are we in a recession? Is a recession coming? These are the types of things people search for on the internet during times of economic uncertainty. In fact, as our featured chart above shows, when people have historically been nervous about the economy, they...
by NelsonCorp Wealth Management | Jul 14, 2023 | Chart of the Week
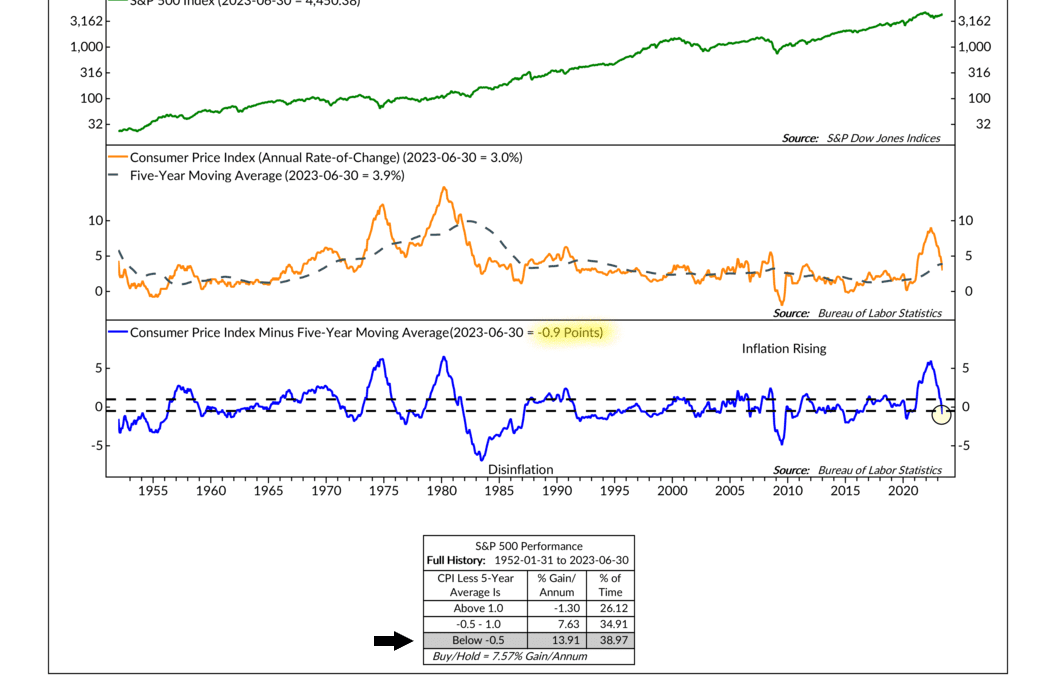
The big economic news this week was the release of the Consumer Price Index (CPI) on Wednesday—and it was a good one. On a year-over-year basis, the headline CPI eased to 3.0% last month, the slowest pace since March 2021. This was a pivotal development for the...
by NelsonCorp Wealth Management | Jul 7, 2023 | Chart of the Week
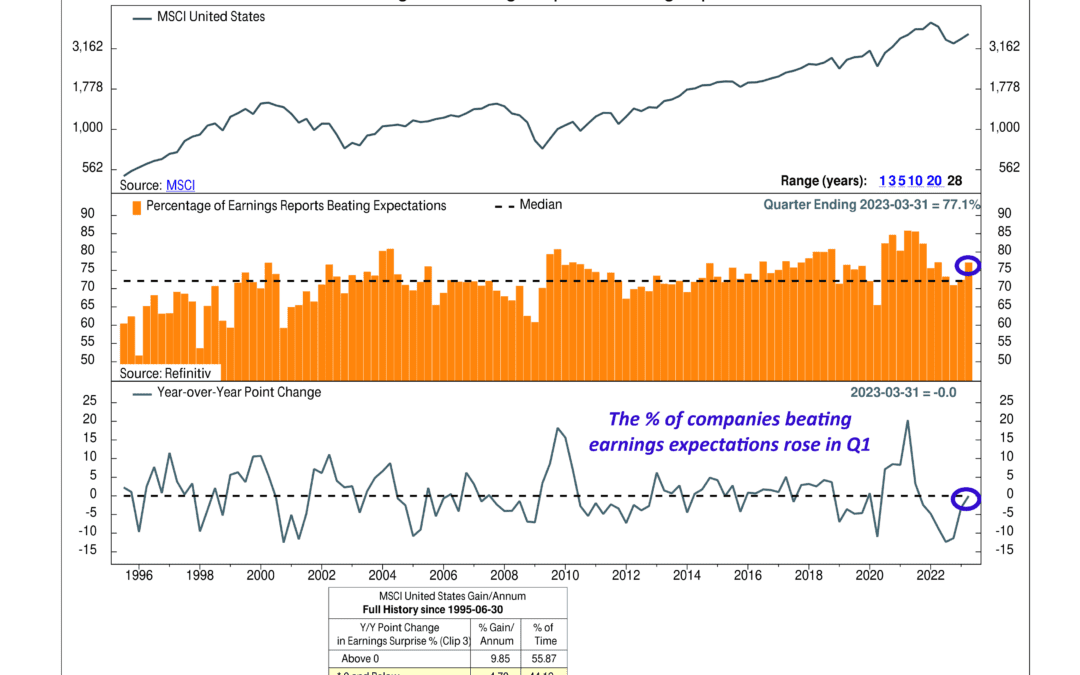
This week’s featured chart shows that the percentage of companies in the U.S. stock market-beating earnings expectations increased significantly in the first quarter of the year, breaking a prolonged downturn that started near the end of 2021. As the middle...
by NelsonCorp Wealth Management | Jun 30, 2023 | Chart of the Week
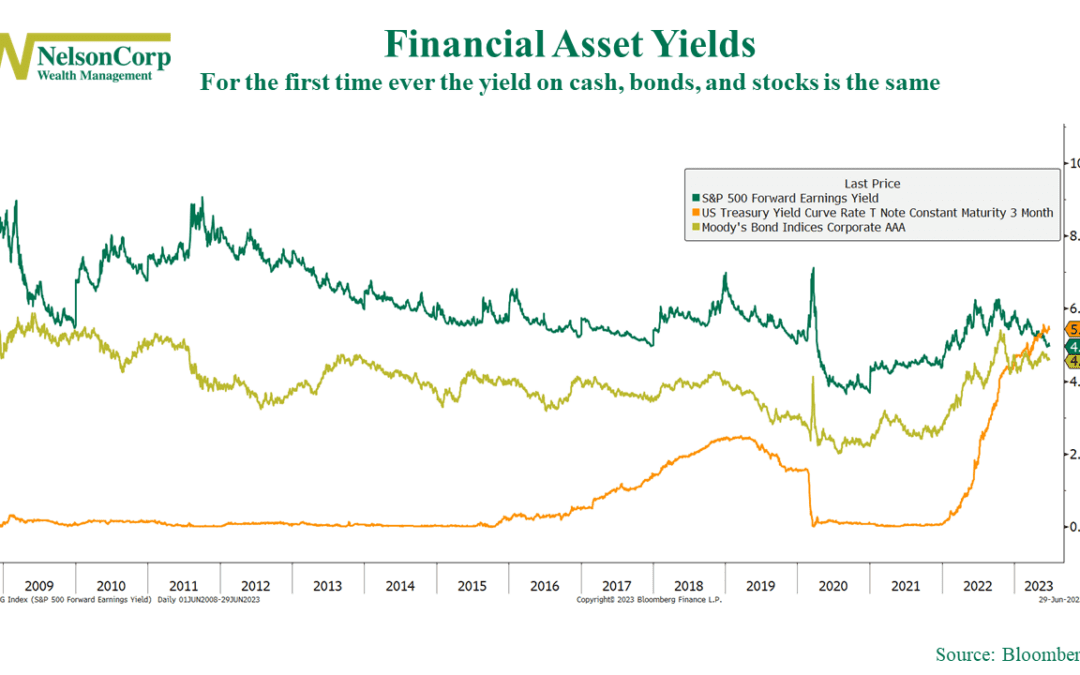
This week’s chart features the yields of the three primary financial assets investors focus on: cash, bonds, and stocks. The green line represents the forward earnings yield for the S&P 500 (stocks), the gold line represents the yield on investment-grade...
by NelsonCorp Wealth Management | Jun 23, 2023 | Chart of the Week
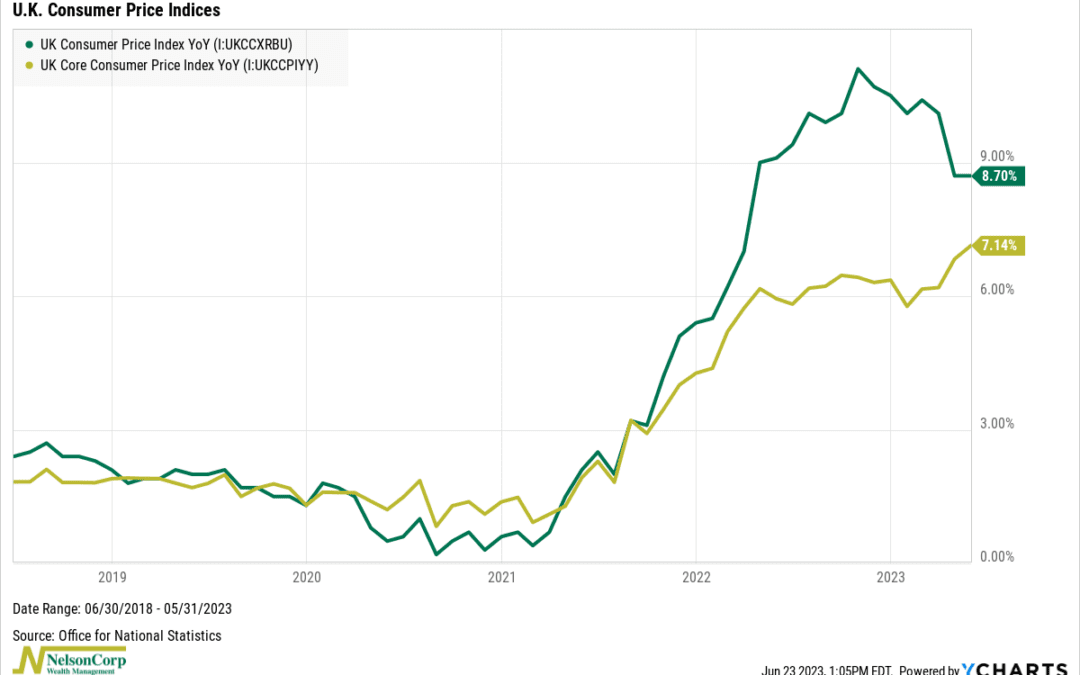
We’ve discussed how inflation seems to be moving in the right direction here in the U.S. But across the pond, things look more worrisome. The U.K. has the worst inflation problem of any major developed county, and last month, it got worse. As our featured chart...
by NelsonCorp Wealth Management | Jun 16, 2023 | Chart of the Week
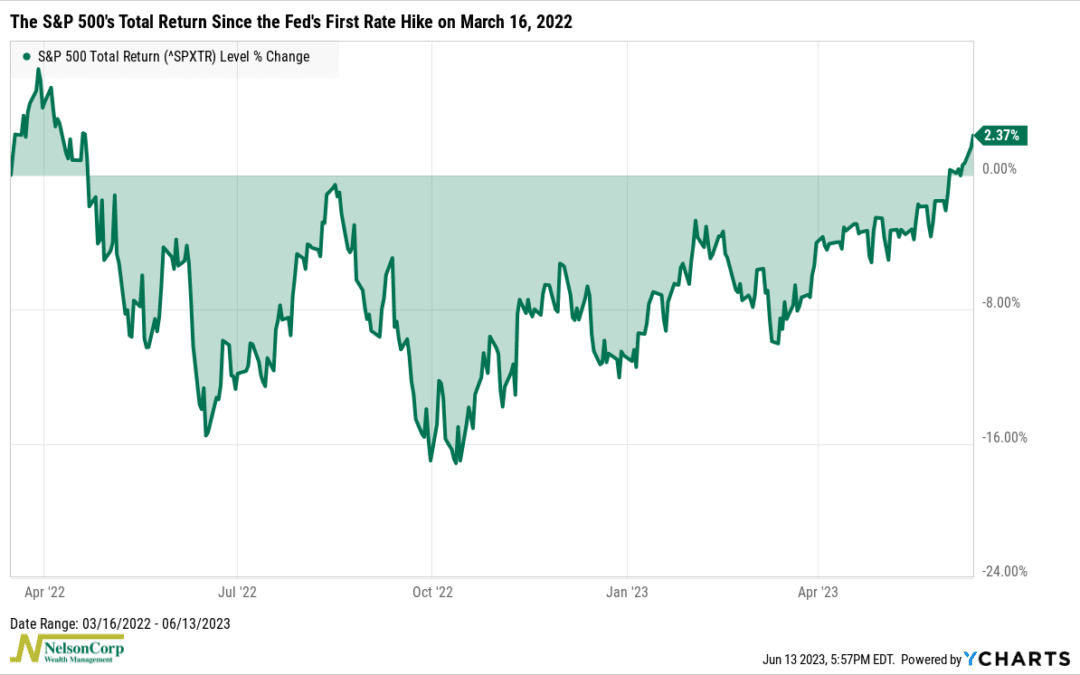
The stock market has been on quite the roller coaster ride since the Fed first started hiking rates last year to fight inflation. But, as our featured chart this week shows, the S&P 500 is finally back in the black for the first time since it originally...
