by NelsonCorp Wealth Management | Jun 9, 2023 | Chart of the Week
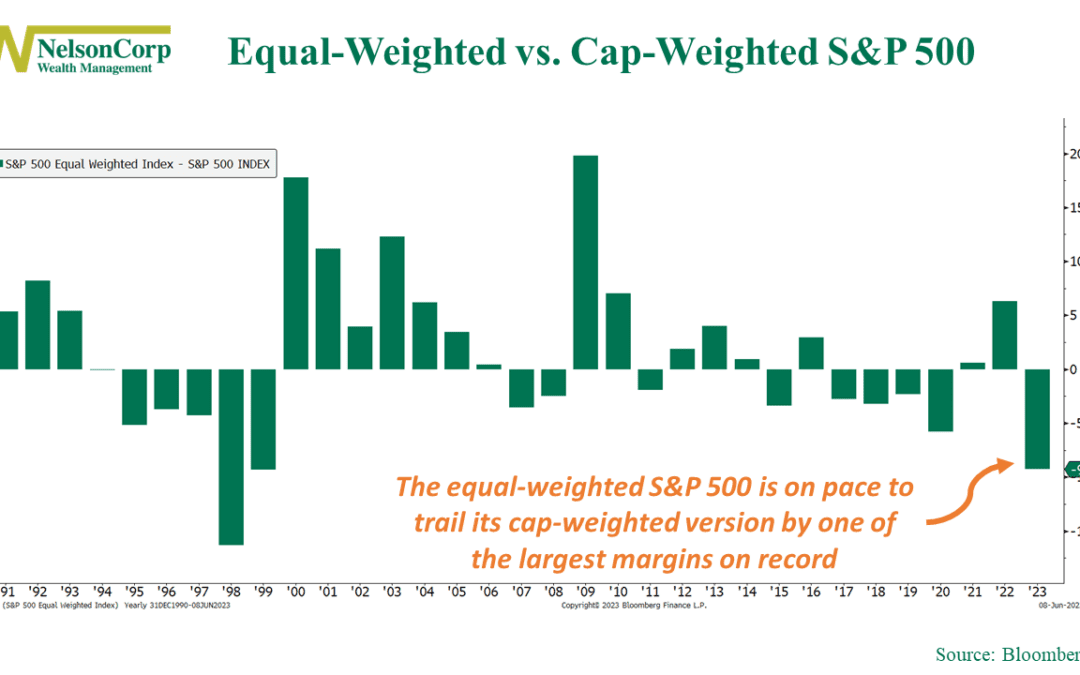
We find ourselves in yet another tale of two markets this year. The tech-heavy Nasdaq is up nearly 30% year-to-date, whereas the blue-chip-heavy Dow was flat through May—the widest spread in nearly 40 years. Another way to view how narrow this market rally has...
by NelsonCorp Wealth Management | Jun 2, 2023 | Chart of the Week
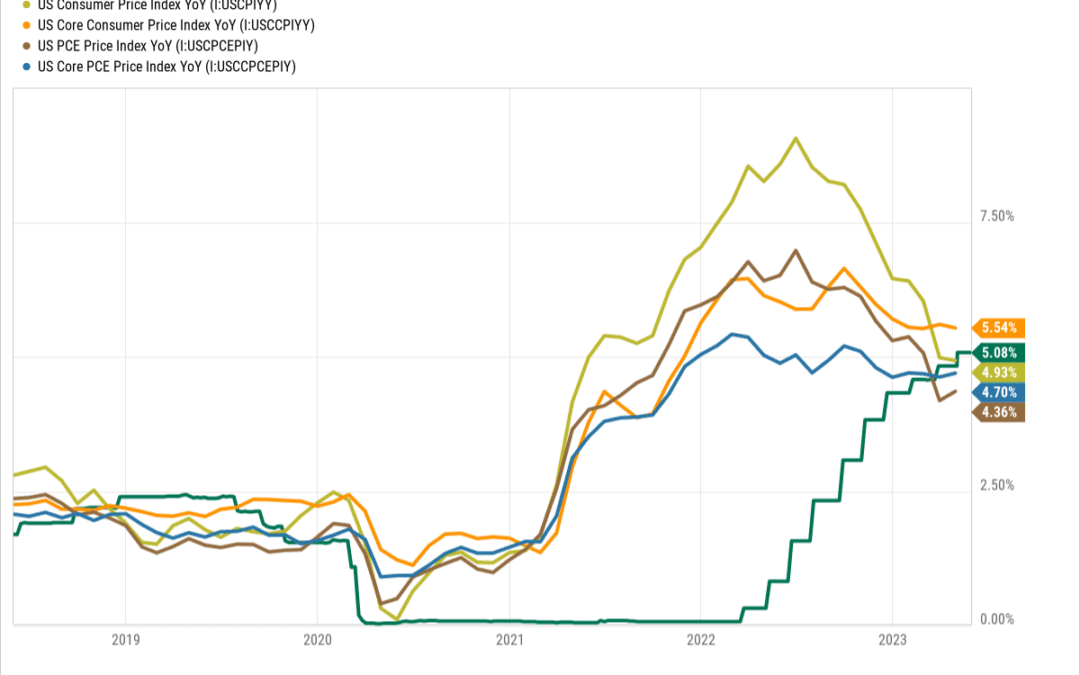
Inflation has been a thorn in the side of investors for a while now. But the good news is that we recently hit a major milestone in the fight against inflation. As our featured chart of the week above shows, the fed funds rate—the rate controlled by the Federal...

by NelsonCorp Wealth Management | May 26, 2023 | Chart of the Week
The clock is ticking for the U.S. government’s finances. As our featured chart above shows, Uncle Sam’s checking account—something known as the Treasury General Account—is quickly shrinking. This week’s latest update showed the balance dropping to less than $50...

by NelsonCorp Wealth Management | May 19, 2023 | Chart of the Week
Sluggish growth continues to plague the U.S. economy. Retail sales and industrial production, both of which are strongly correlated with economic growth, came in unusually weak last month. The year-over-year change in retail sales, shown below, rose just 0.5% in...

by NelsonCorp Wealth Management | May 12, 2023 | Chart of the Week
There’s an adage on Wall Street that goes something like, “Sell in May and walk away.” It refers to the stock market’s tendency to underperform for the six calendar months of May through October and outperform from November through April. Just how big is the...

by NelsonCorp Wealth Management | May 5, 2023 | Chart of the Week
If there’s one thing investors don’t like, it’s uncertainty. Unfortunately, now is one of those times when uncertainty is especially high regarding what is going on in Washington with the upcoming debt ceiling. This week’s featured chart does a great job of...
