
by NelsonCorp Wealth Management | Apr 28, 2023 | Chart of the Week
There’s a new type of “fear gauge” on Wall Street: the 1-Day VIX. Launched by the Chicago Board Options Exchange on Monday, the Cboe 1-Day Volatility Index is designed to measure implied volatility in the S&P 500 Index over a single day, as opposed to its...
by NelsonCorp Wealth Management | Apr 21, 2023 | Chart of the Week
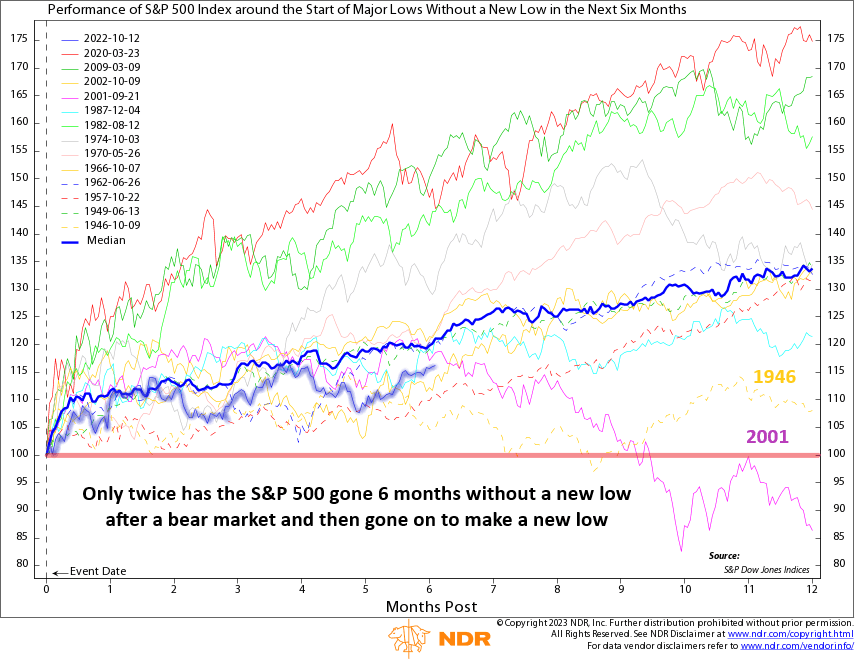
This week, we have a fun little chart showing how the S&P 500 stock index has performed after going six months without a new 52-week low after entering a bear market. Each date on the chart represents the lowest point of significant declines of 20% or more,...
by NelsonCorp Wealth Management | Apr 14, 2023 | Chart of the Week
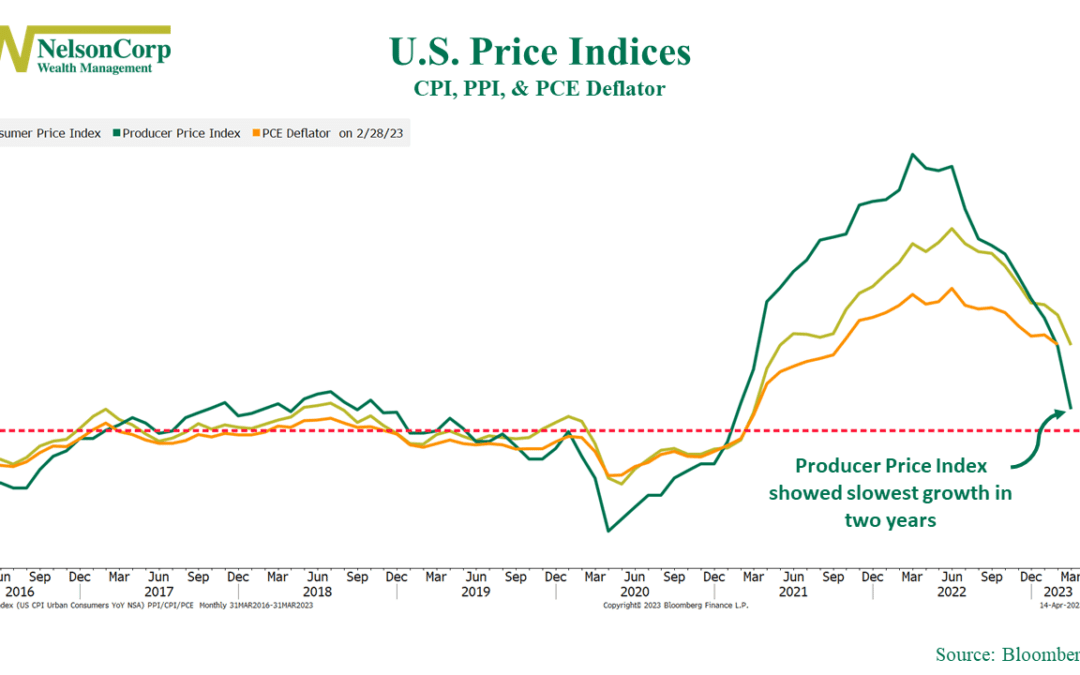
We continue to see encouraging signs that inflation is cooling off in the economy. Our featured chart above illustrates that the U.S. Consumer Price Index (CPI), Producer Price Index (PPI), and PCE Deflator have all exhibited declines in their year-over-year...
by NelsonCorp Wealth Management | Apr 7, 2023 | Chart of the Week
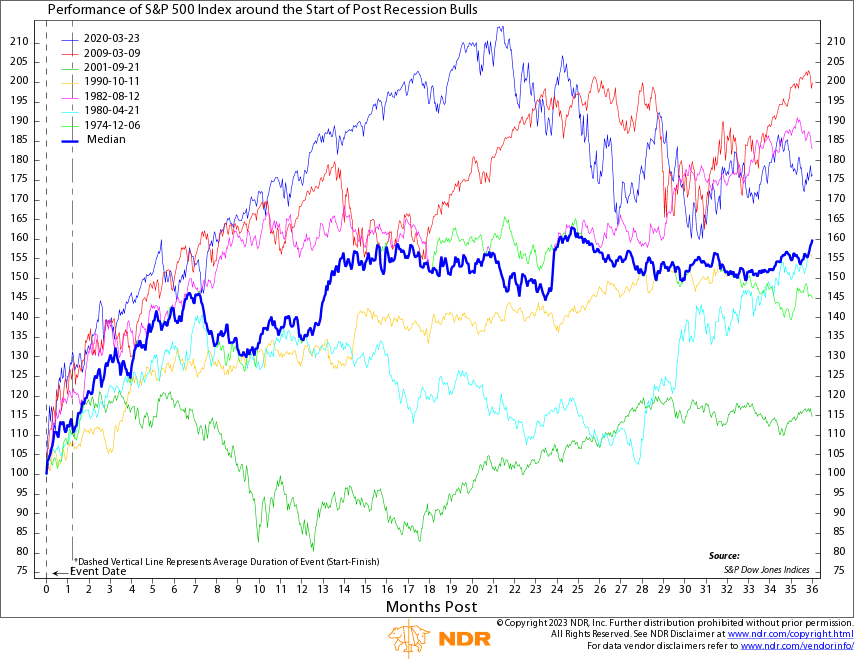
The topic of a potential recession, that dreaded “R” word, has been the subject of much discussion lately. Yet, our highlighted chart this week provides some hopeful news, indicating that bull markets generally exhibit strong performance following...
by NelsonCorp Wealth Management | Mar 31, 2023 | Chart of the Week
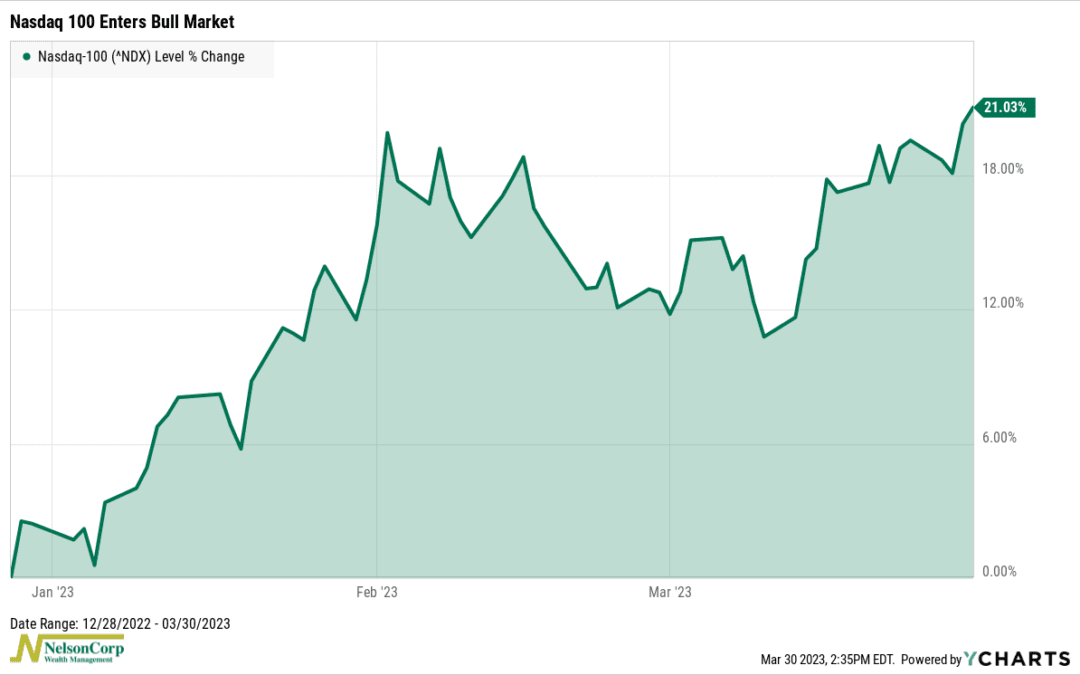
This week’s big news was that the Nasdaq 100 Index—a basket of the 100 largest (mostly tech) stocks traded on the Nasdaq stock exchange—surged into a new bull market on Wednesday. Our featured chart above shows that the tech-heavy index has rallied more...
by NelsonCorp Wealth Management | Mar 24, 2023 | Chart of the Week
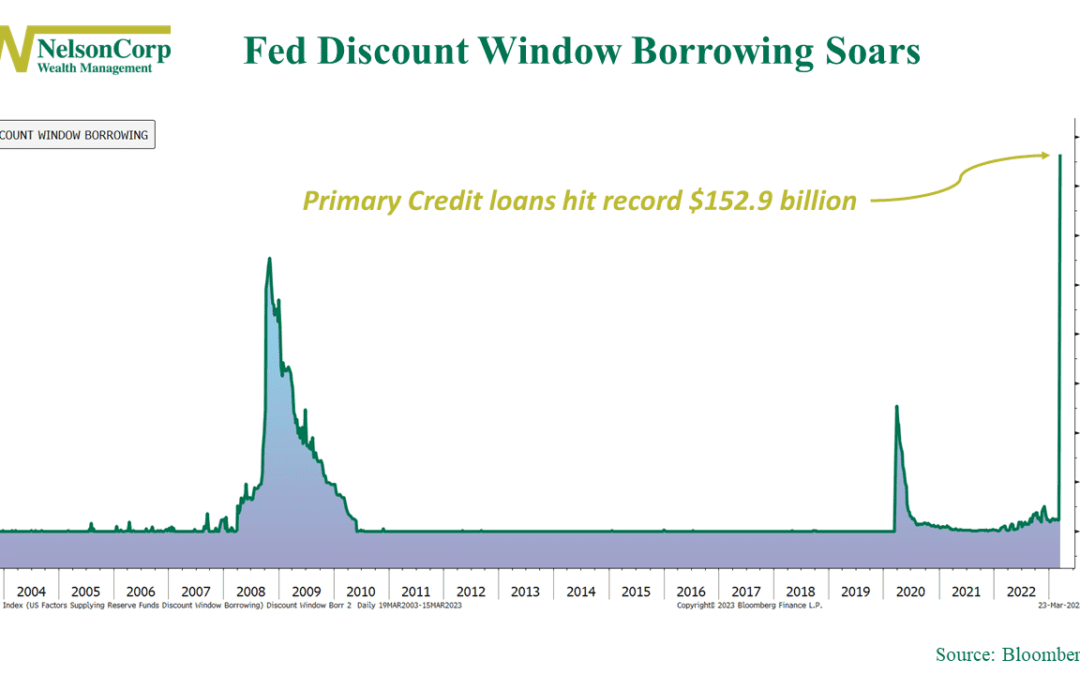
There’s been a lot of stress in the banking system lately. So much so that recent data published by the Fed showed that a record $152.9 billion was borrowed from the Fed’s discount window last week, surpassing the $111 billion reached during the 2008 financial...
