by NelsonCorp Wealth Management | Dec 23, 2022 | Chart of the Week
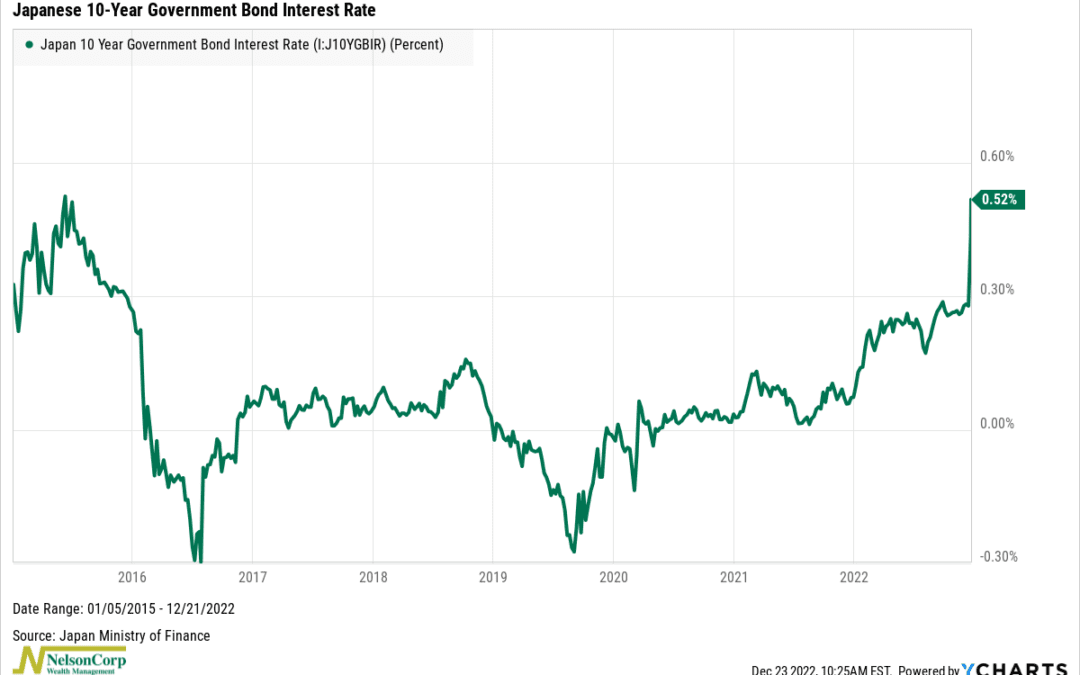
Japan’s central bank, the Bank of Japan, made quite a stir in the financial world this week when it announced that it is relaxing the allowed trading band for 10-year Japanese government bonds (known as JGBs) by 25 basis points. This means that, after keeping...
by NelsonCorp Wealth Management | Dec 16, 2022 | Chart of the Week
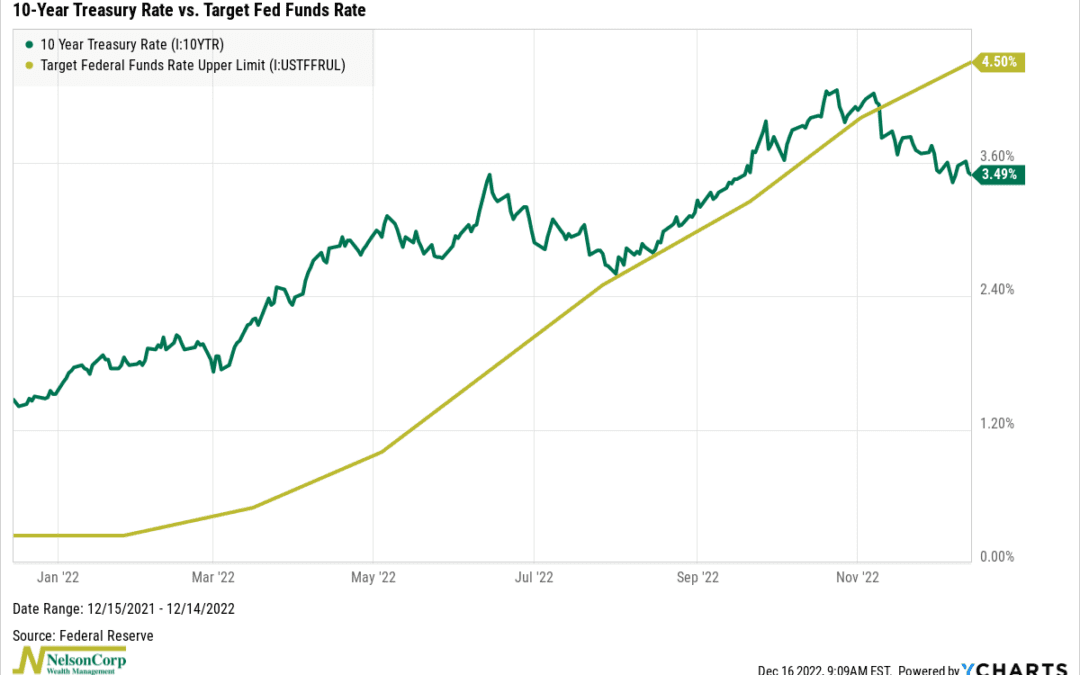
This week’s chart features two extremely important interest rates for the U.S. economy: the 10-year Treasury rate and the fed funds rate. The 10-year Treasury rate is a longer-term rate that the U.S. government charges on the money it borrows for ten years. By...
by NelsonCorp Wealth Management | Dec 9, 2022 | Chart of the Week
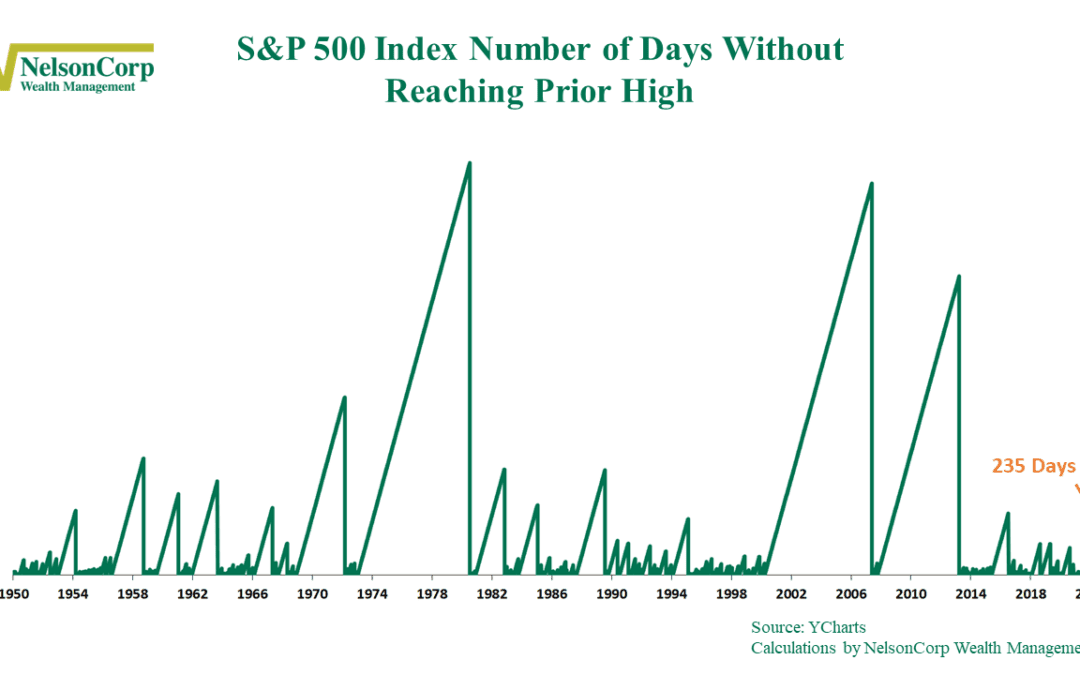
The S&P 500 Index is a popular stock market index often used to measure the overall health of the U.S. stock market. One way to gauge the strength of the market is to look at the number of days the index spends below its prior high. As I’ve pointed out on...

by NelsonCorp Wealth Management | Dec 2, 2022 | Chart of the Week
We’ve talked some this year about the U.S. yield curve and how its inversion is signaling that a recession could be right around the corner. But it’s not just a U.S. problem. Global bonds joined the party this week. The chart above shows that the average yield...

by NelsonCorp Wealth Management | Nov 18, 2022 | Chart of the Week
Supply chain stresses are getting better. That’s the message from this week’s featured chart, highlighted above, showing various regional Fed manufacturing indexes of supplier delivery times. Supplier delivery times are one of the most important economic...

by NelsonCorp Wealth Management | Nov 11, 2022 | Chart of the Week
This week’s featured chart is the ICE BofA MOVE Index, a well-known measure of U.S. interest rate volatility. Specifically, the MOVE Index calculates future volatility in U.S. Treasury yields implied by prices of one-month options on Treasuries of various...
