
by NelsonCorp Wealth Management | Nov 15, 2023 | Indicator Insights
This week’s featured indicator is the Zweig Thrust Indicator, named after the savvy financial analyst and investor Martin Zweig. This so-called market breadth indicator is all about figuring out how strong a market rally is. The indicator (shown as the orange...

by NelsonCorp Wealth Management | Nov 2, 2023 | Indicator Insights
The markets are getting bumpy, so let’s dive into this week’s topic: the SHUT Index and what it’s revealing about the current state of financial markets. The SHUT Index, which stands for Staples, Healthcare, Utilities, and Telecommunications,...
by NelsonCorp Wealth Management | Oct 25, 2023 | Indicator Insights
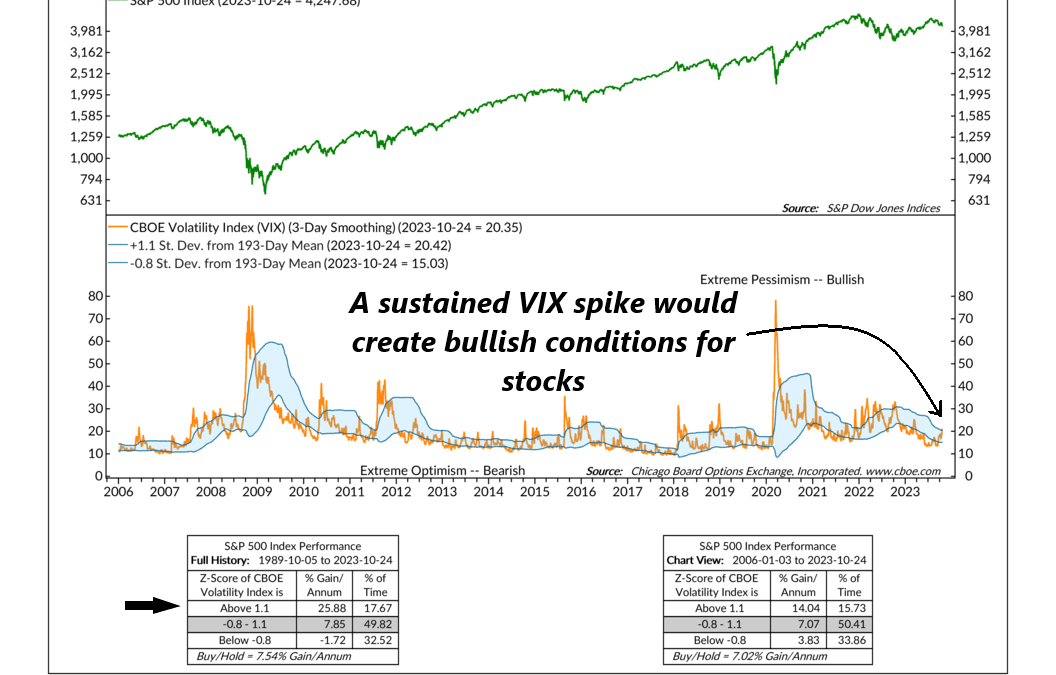
The VIX Index is one of those esoteric things that financial professionals think about frequently but likely goes unnoticed by the average person. Therefore, in this week’s discussion, we’ll shed some light on the VIX Index and highlight why it’s...

by NelsonCorp Wealth Management | Oct 18, 2023 | Indicator Insights
At times, the stock market can seem like a mystery—a hard-to-solve puzzle. But like any good detective, we have tools to help peel away the layers and unearth some underlying truths about the stock market. One such tool is an indicator called a stochastic. A...

by NelsonCorp Wealth Management | Oct 11, 2023 | Indicator Insights
This week’s indicator is all about thrust. In the physical world, thrust is the force that moves an object, such as a rocket, through the air. It takes a lot of force, generated in a short amount of time, to get something like a rocket into space. If the rocket...
by NelsonCorp Wealth Management | Oct 4, 2023 | Indicator Insights
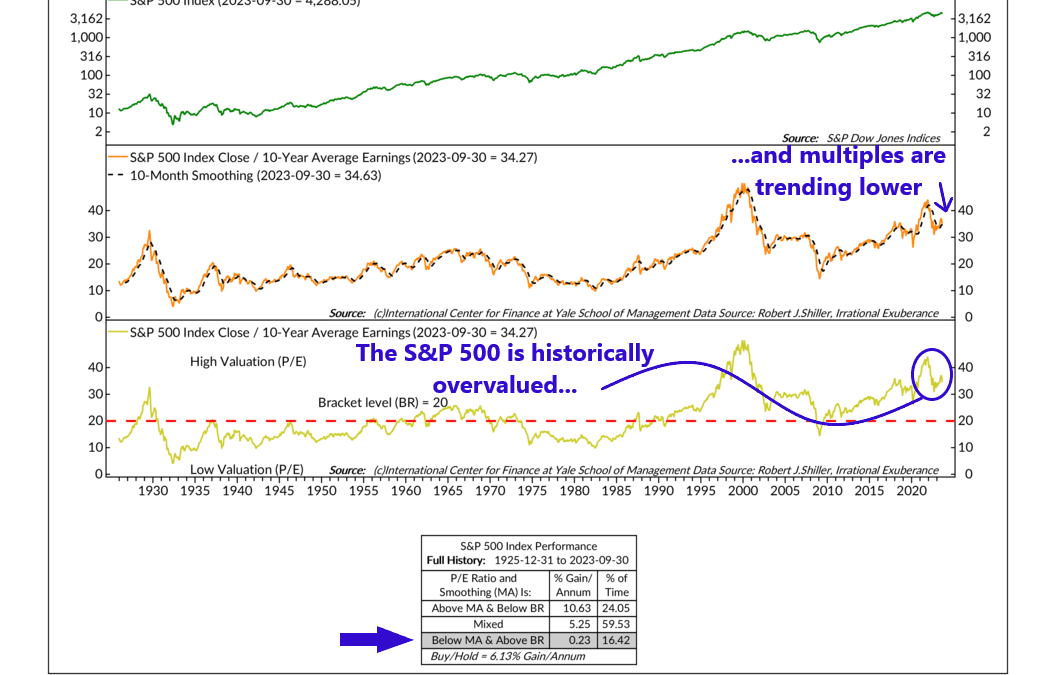
Valuing the stock market can be tricky; creating an actionable signal from that exercise can be even trickier. That’s because, as the famous saying attributed to the economist John Maynard Keynes goes, the stock market can remain irrational longer than you can...
