
by NelsonCorp Wealth Management | Sep 29, 2022 | Indicator Insights
Let’s say you’re an investor, and you want to place a bullish bet on the stock market. One way to do this would be to buy a call option. The value of a call option goes up when the price of a stock (or stock index) goes up—and it does so at a faster rate than...
by NelsonCorp Wealth Management | Sep 22, 2022 | Indicator Insights
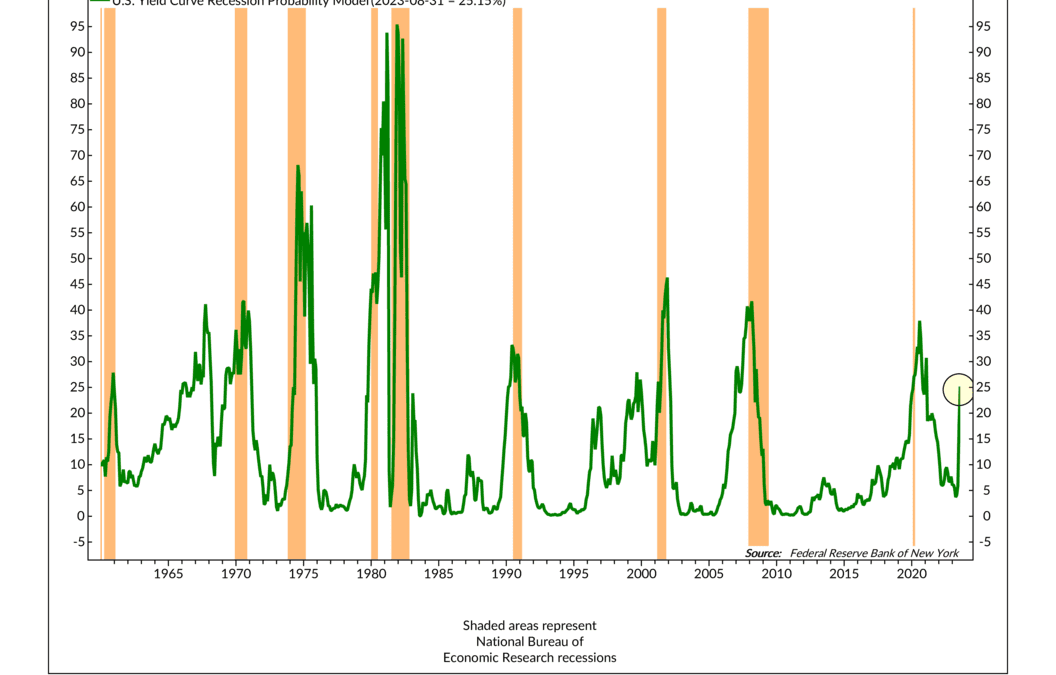
This week’s indicator looks at the yield curve and how its shape can be used to anticipate when an economic recession is becoming more likely. The portion of the yield curve that it focuses on is the 10-year Treasury rate and the 3-month Treasury rate. The New...

by NelsonCorp Wealth Management | Sep 15, 2022 | Indicator Insights
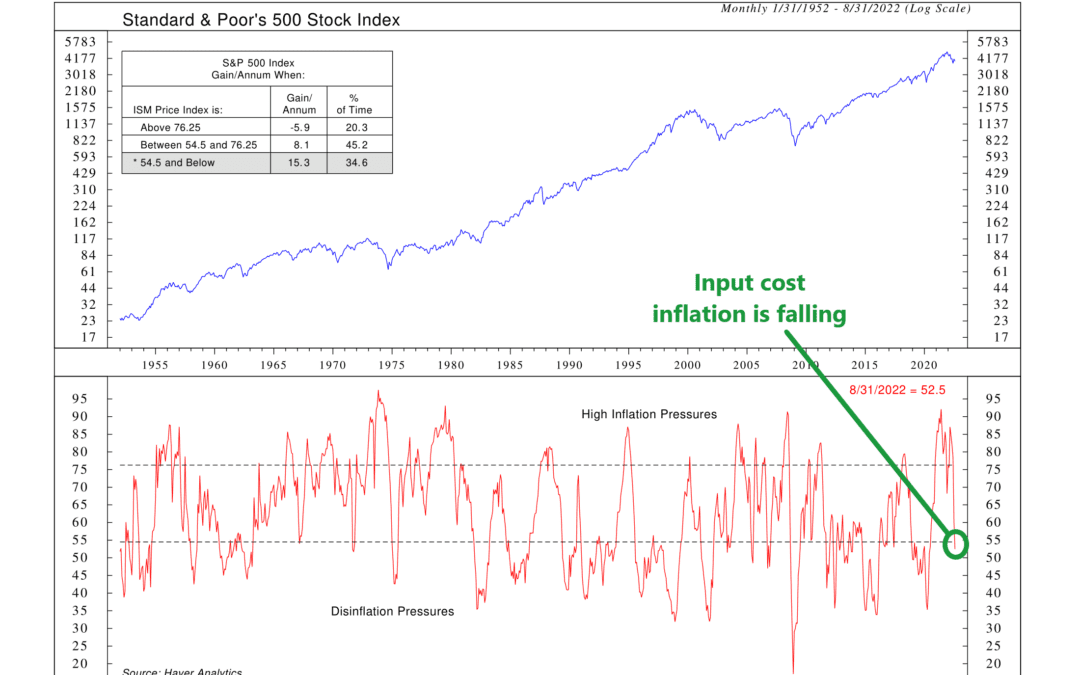
This week’s featured indicator examines the relationship between stock performance and inflation in the U.S. The indicator uses two main inputs: the year-to-year change in the Consumer Price Index (CPI) and the six-month smoothing or average of the CPI....
by NelsonCorp Wealth Management | Sep 8, 2022 | Indicator Insights
Every month, the Institute of Supply Management (ISM) conducts surveys of purchasing managers at hundreds of manufacturing firms in the U.S. and compiles the results into an index. Among the various sub-indices in the report is an index that measures the prices...
by NelsonCorp Wealth Management | Sep 1, 2022 | Indicator Insights
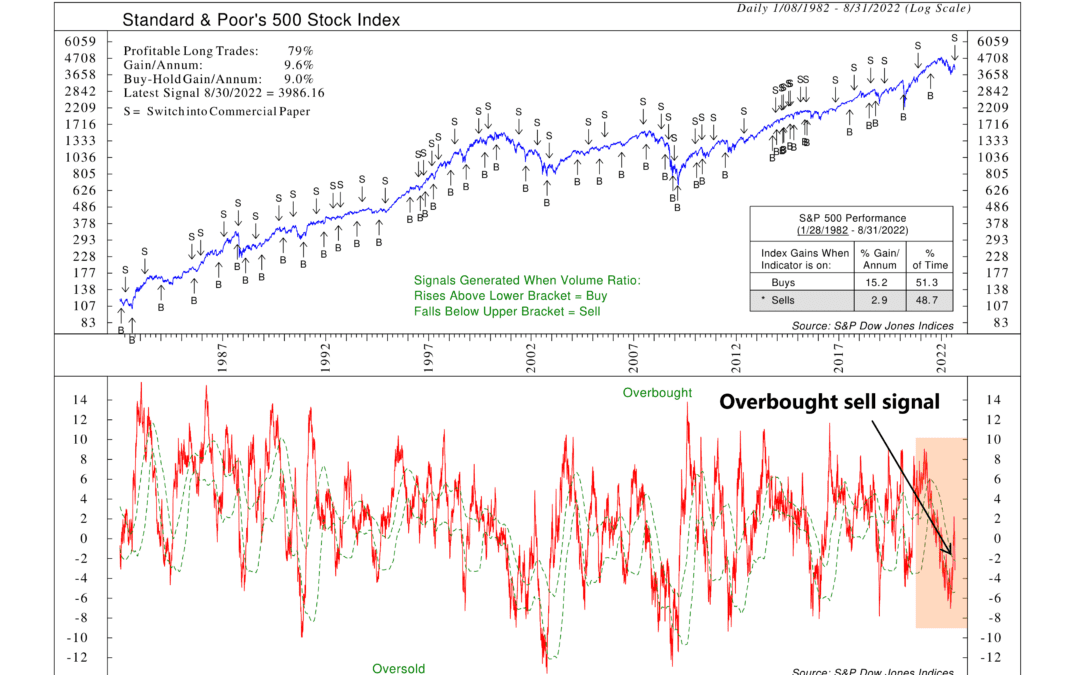
Volume—or the number of shares traded in the stock market—is an important metric for financial markets. We look at volume because, in general, when a rising stock has a lot of volume, it’s a sign of strength. But when the stock is falling on a lot of volume, it...
by NelsonCorp Wealth Management | Aug 25, 2022 | Indicator Insights
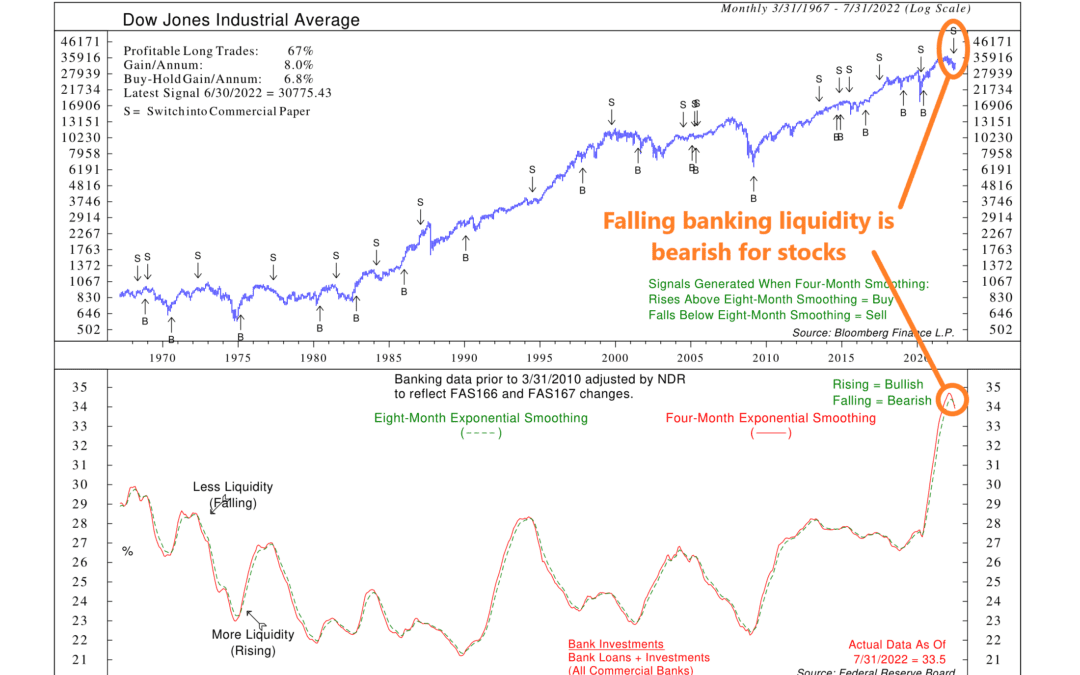
This week’s featured indicator looks at banking liquidity and how it affects stock market performance over time. The core idea is that a rising trend in liquidity is bullish for the stock market because it reduces pressure on interest rates. Falling liquidity,...