by NelsonCorp Wealth Management | Aug 18, 2022 | Indicator Insights
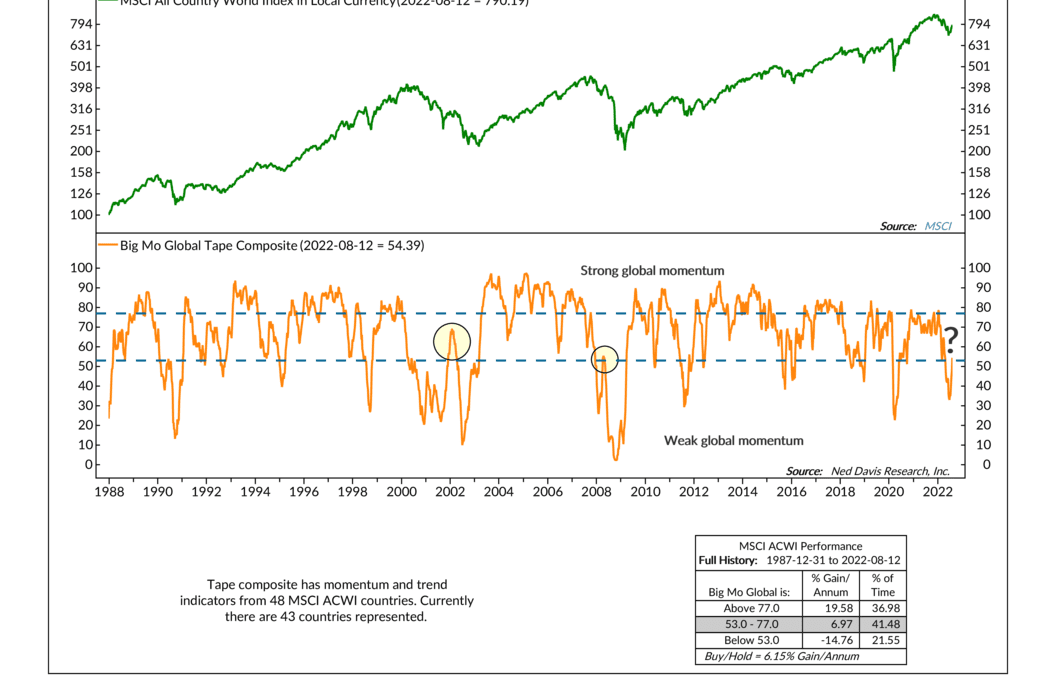
When big moves happen in the stock market, they tend to be global in nature. In other words, stock price momentum in one country can spill over into other countries, creating what we call a “mega-move” in global financial markets. To measure this dynamic, we...
by NelsonCorp Wealth Management | Aug 11, 2022 | Indicator Insights
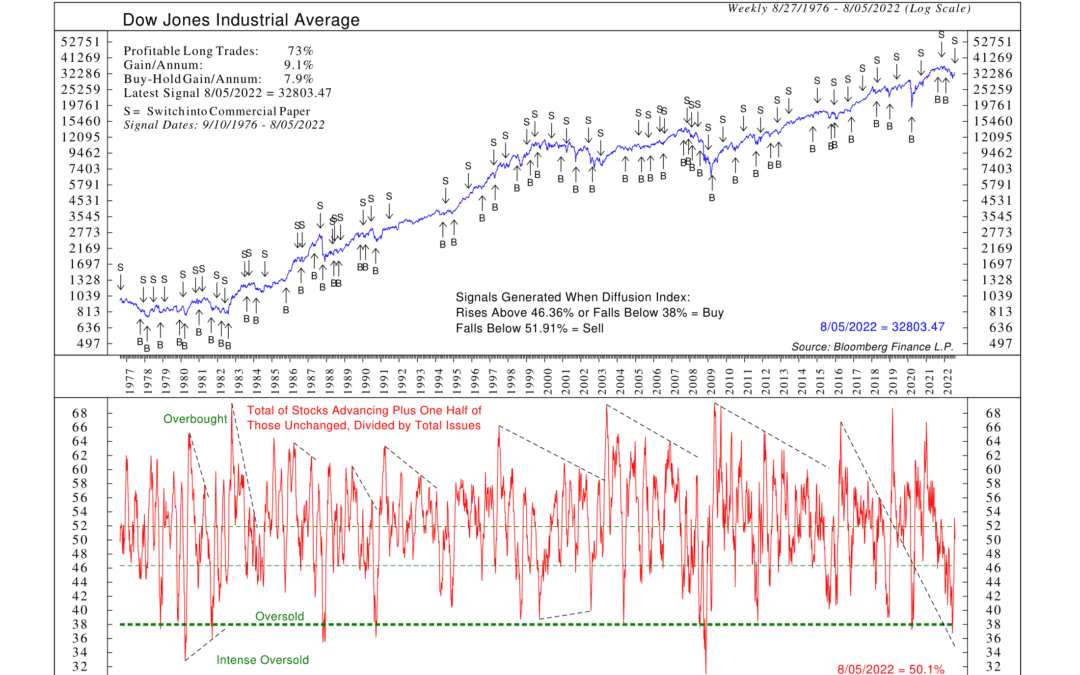
This week’s indicator is based on a contrarian concept originated by the investment bank Merrill Lynch. It looks at the ratio of the number of stocks advancing plus one-half of those unchanged to the total number of issues traded. In other words, it’s a measure...

by NelsonCorp Wealth Management | Aug 4, 2022 | Indicator Insights
This week, I want to feature an indicator we’ve recently discussed on the blog. It’s a price-based indicator that measures reversals in the stock market. Specifically, it generates buy and sell signals for the S&P 500 index based on percentage reversals...
by NelsonCorp Wealth Management | Jul 28, 2022 | Indicator Insights
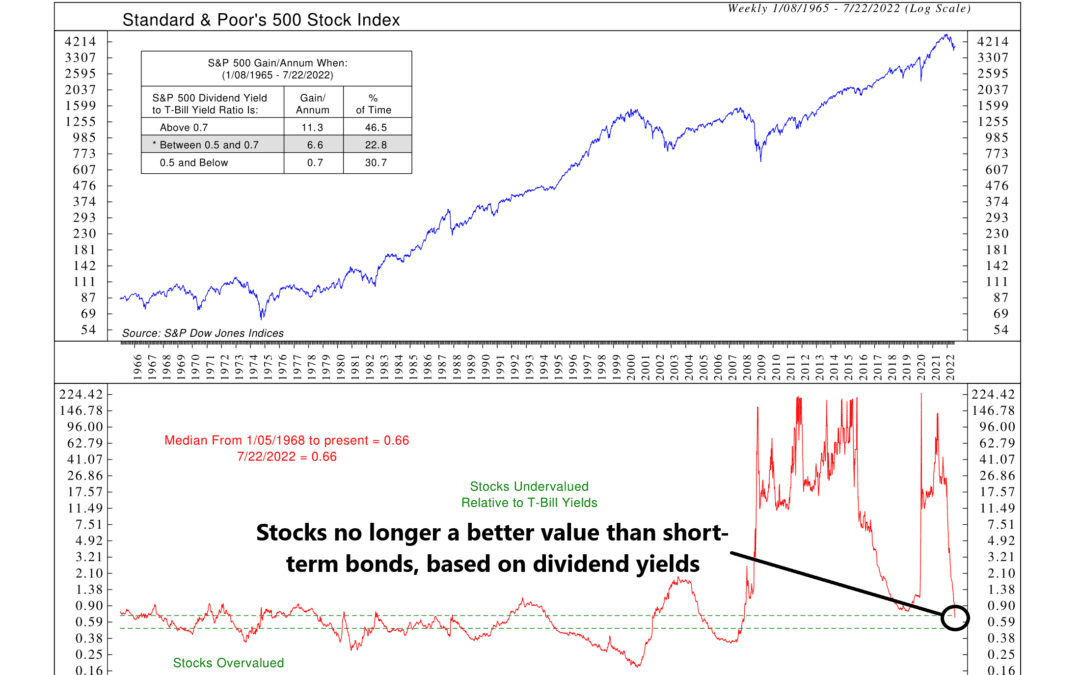
Near the end of the 1990s, two well-known economists, Robert Shiller and John Campbell argued that the high ratio of stock prices to dividends indicated that the stock market was seriously overvalued. In other words, they thought the dividend yield (dividends...

by NelsonCorp Wealth Management | Jul 21, 2022 | Indicator Insights
Whenever there’s talk about what drives the stock market, it usually comes back to two main factors: earnings and what investors are willing to pay for those earnings. A common way to quantify this relationship is to look at something called a price-to-earnings...
by NelsonCorp Wealth Management | Jul 14, 2022 | Indicator Insights
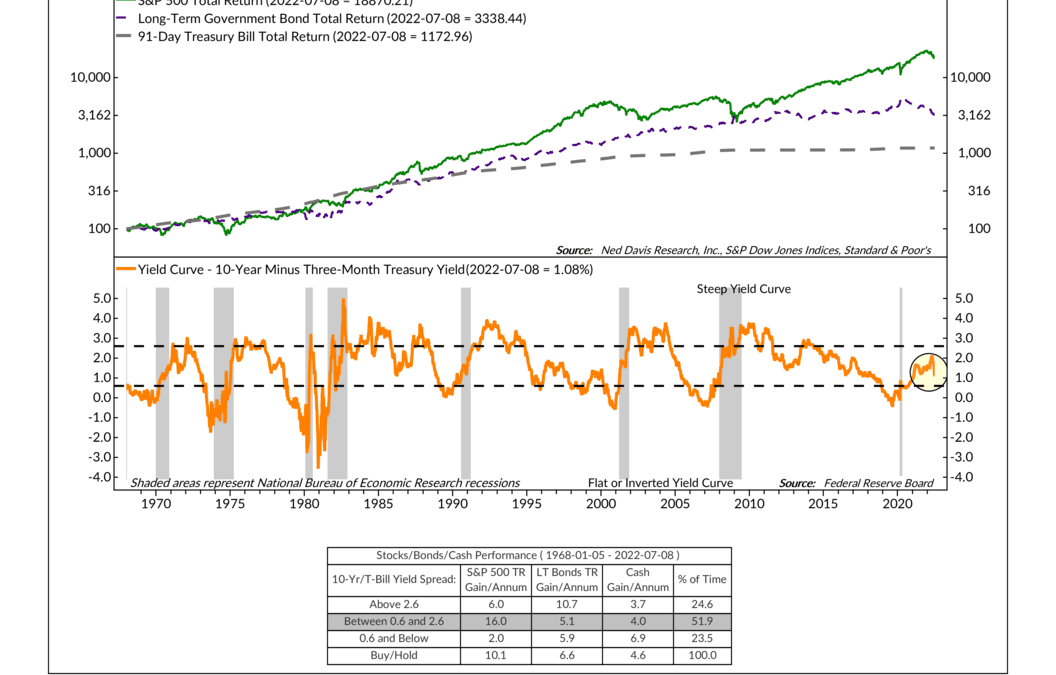
For this week’s indicator, we have a metric that measures the Treasury yield curve. This specific yield curve looks at the difference between the yield on a 10-year Treasury bond versus a 3-month Treasury bond. This is depicted as the orange line on the bottom...