by NelsonCorp Wealth Management | Jan 20, 2022 | Indicator Insights
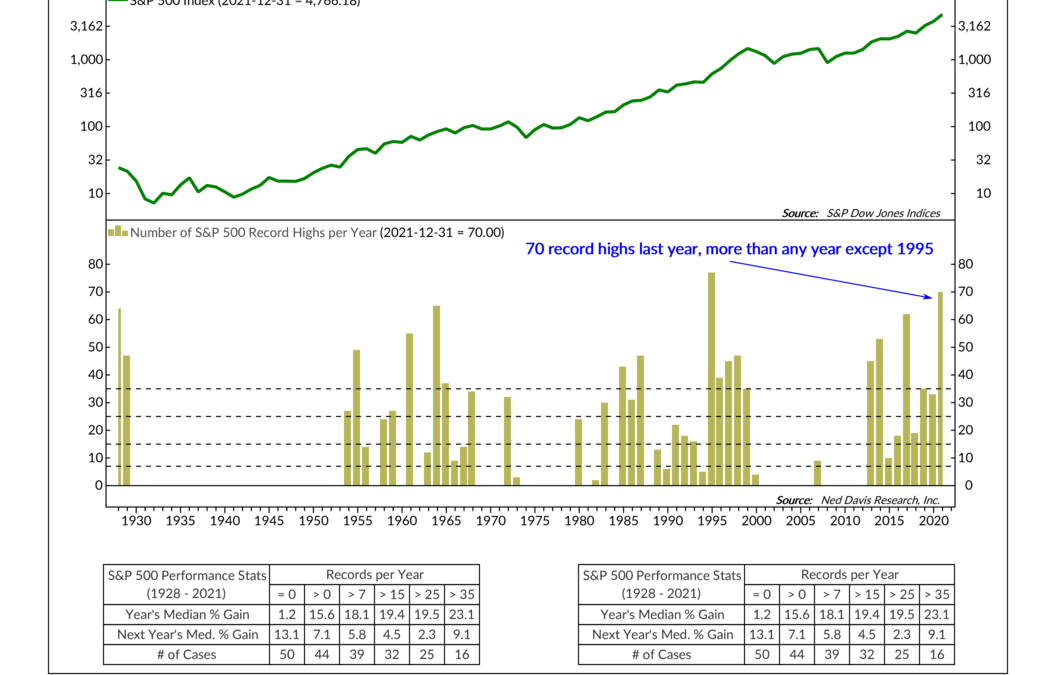
This week I want to drill down a little deeper on a chart that we highlighted around the middle of last year. It’s the number of record highs attained by the S&P 500 stock market index per year, going back to 1928. I bring this chart up because, as you can...

by NelsonCorp Wealth Management | Jan 14, 2022 | Indicator Insights
The primary goal of any business is to make a profit; or, at the very least, profits validate a business’s commercial endeavors. So, for this week’s chart, we show the profit margin of S&P 500 companies over the past 50 years. As you can see on the far...

by NelsonCorp Wealth Management | Jan 13, 2022 | Indicator Insights
The one thing made apparent last year is that liquidity matters to the stock market. By liquidity, we mean the amount of available money sloshing around the economy; when it’s excessive, it tends to find its way into financial assets—like stocks. One of the...

by NelsonCorp Wealth Management | Jan 6, 2022 | Indicator Insights
I like to think of this week’s featured indicator as a tug of war between the two major stock exchanges in North America: the Nasdaq and the New York Stock Exchange (NYSE). The relative differences between these two exchanges create a unique opportunity—which...

by NelsonCorp Wealth Management | Dec 30, 2021 | Indicator Insights
Our good old friend, the VIX Index, is the focus of our featured indicator this week. But what is the VIX Index, you might ask? It’s a real-time market index that uses option pricing on the S&P 500 Index to determine what market participants think...

by NelsonCorp Wealth Management | Dec 16, 2021 | Indicator Insights
The one sport in the Olympics that never ceases to amaze me when I see it is synchronized swimming, also known as water ballet. The way the athletes bob and weave through the water so effortlessly is pretty astonishing. I think it’s one of the most underrated...