by NelsonCorp Wealth Management | Mar 24, 2022 | Indicator Insights
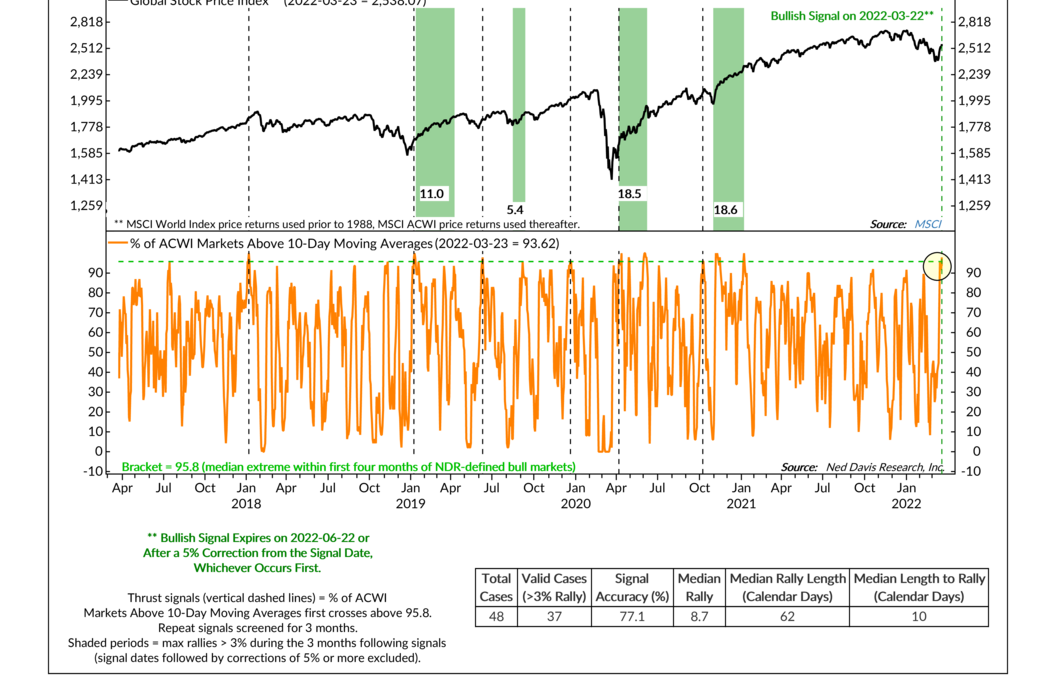
This week’s indicator focuses on two important stock market forces: upside breadth and momentum. A stock with momentum means it is trading at a higher price level compared to its recent past. So, for the stock market as a whole, we want to see a lot of stocks...
by NelsonCorp Wealth Management | Mar 17, 2022 | Indicator Insights
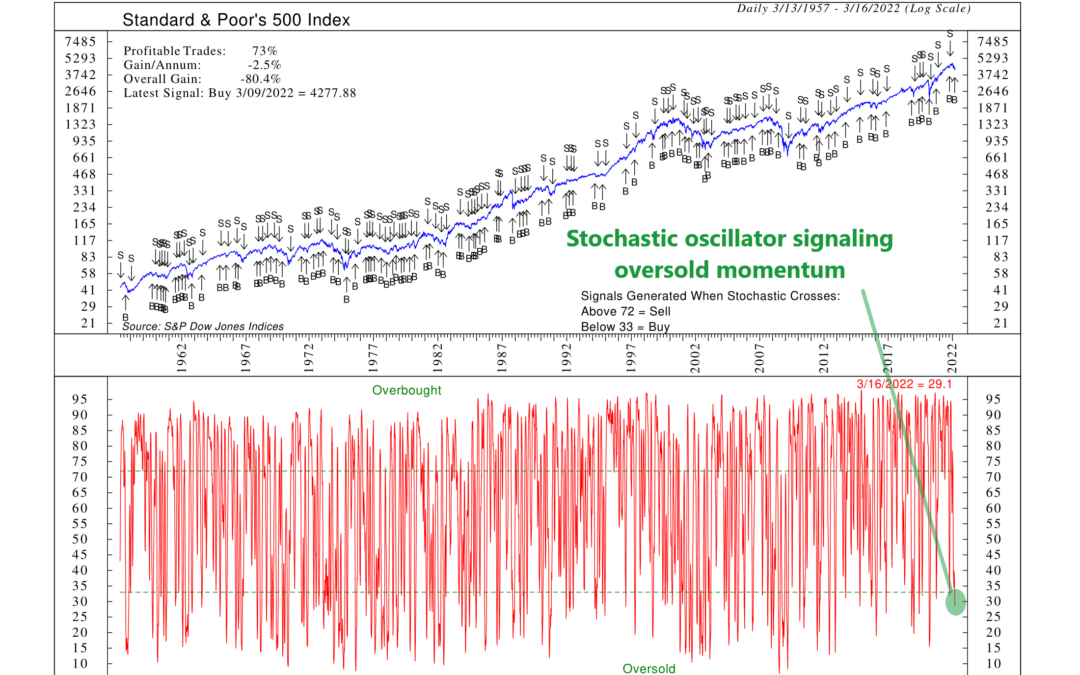
This week’s indicator is a particular type of momentum indicator called a stochastic oscillator. The idea is to compare the closing price of the stock market to a range of its prices over a certain period of time. This specific indicator looks at the range of...
by NelsonCorp Wealth Management | Mar 10, 2022 | Indicator Insights
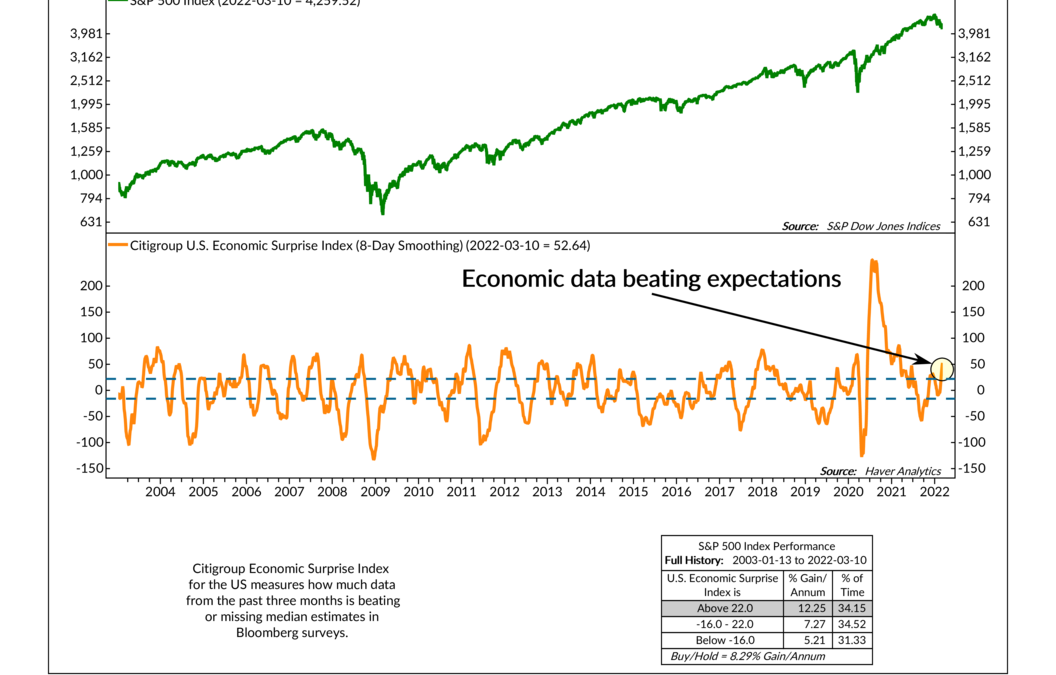
A lot of stuff in the financial world has to do with expectations. The stock market, for example, is based on expectations. It’s a forward-looking mechanism. This means that the price of stocks today reflects—among other things—what investors anticipate the...
by NelsonCorp Wealth Management | Mar 3, 2022 | Indicator Insights
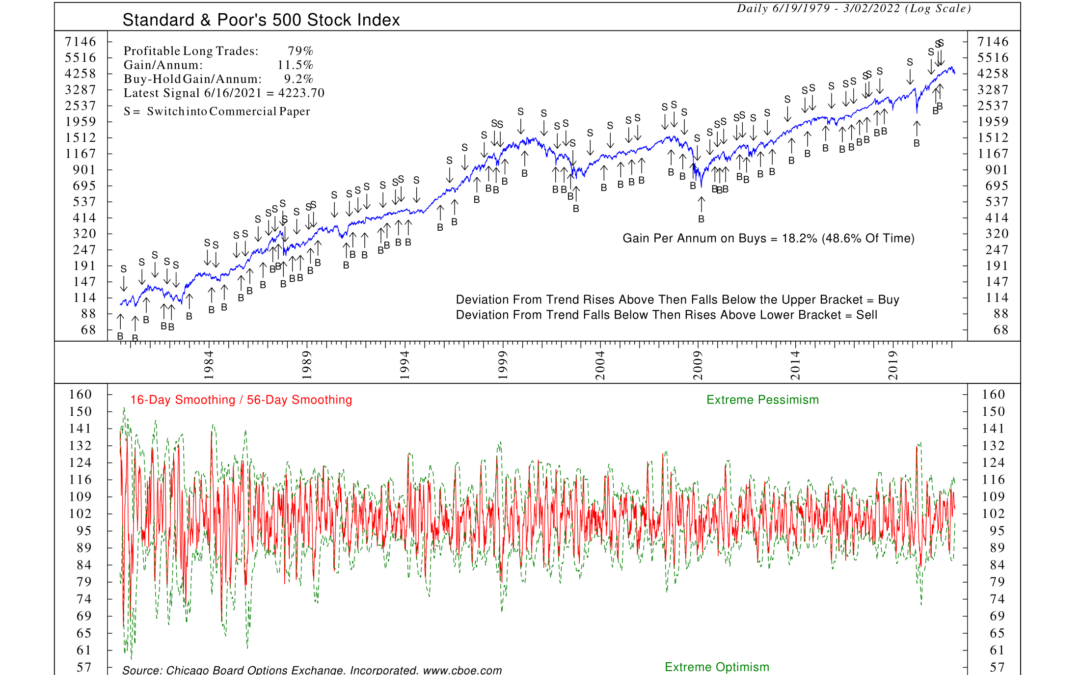
Let’s say you like a particular stock, and you want to buy a lot of it because you think it’s going to go up in price. But there’s a problem: you don’t have or don’t want to put up all the cash required to buy the shares needed. One solution is you could buy a...
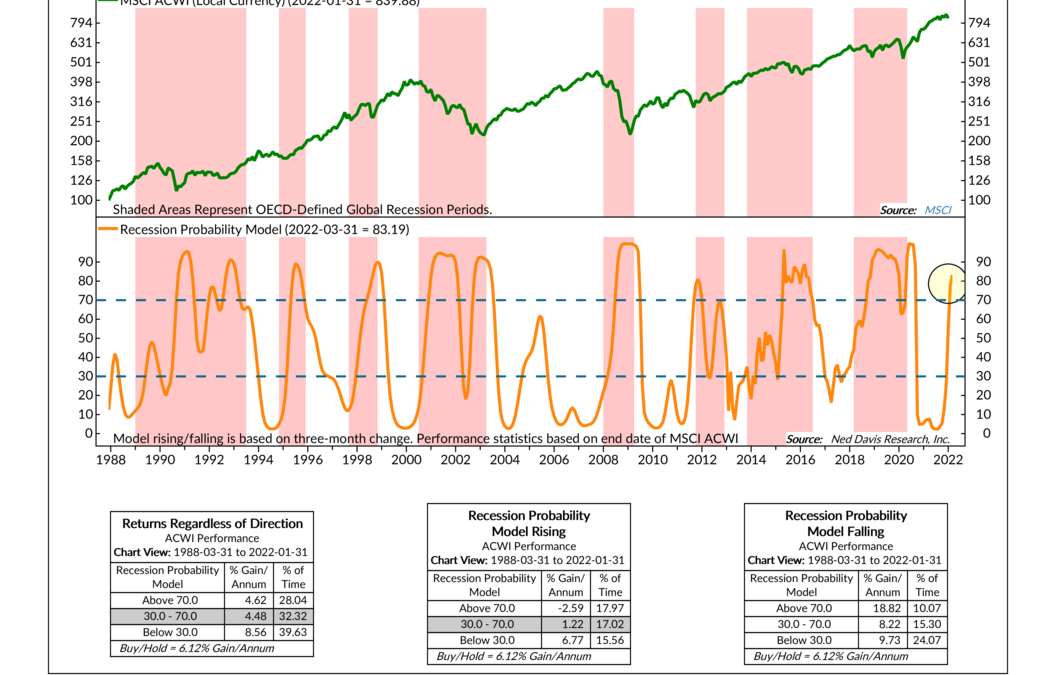
by NelsonCorp Wealth Management | Feb 24, 2022 | Indicator Insights
As with most things, recessions are a hard thing to predict. But, the good news is we have tools at our disposal that help us better understand when global economic slowdowns are occurring. Specifically, we utilize a global recession probability model, shown in...

by NelsonCorp Wealth Management | Feb 17, 2022 | Indicator Insights
When we measure what we call the “price movement” of the stock market, we look at more than just the price changes of a broad-market index like the S&P 500. Other price-related factors matter to stock price movements, as well. Breadth is one of those...
