by NelsonCorp Wealth Management | Mar 3, 2022 | Indicator Insights
Let’s say you like a particular stock, and you want to buy a lot of it because you think it’s going to go up in price. But there’s a problem: you don’t have or don’t want to put up all the cash required to buy the shares needed. One solution is you could buy a...
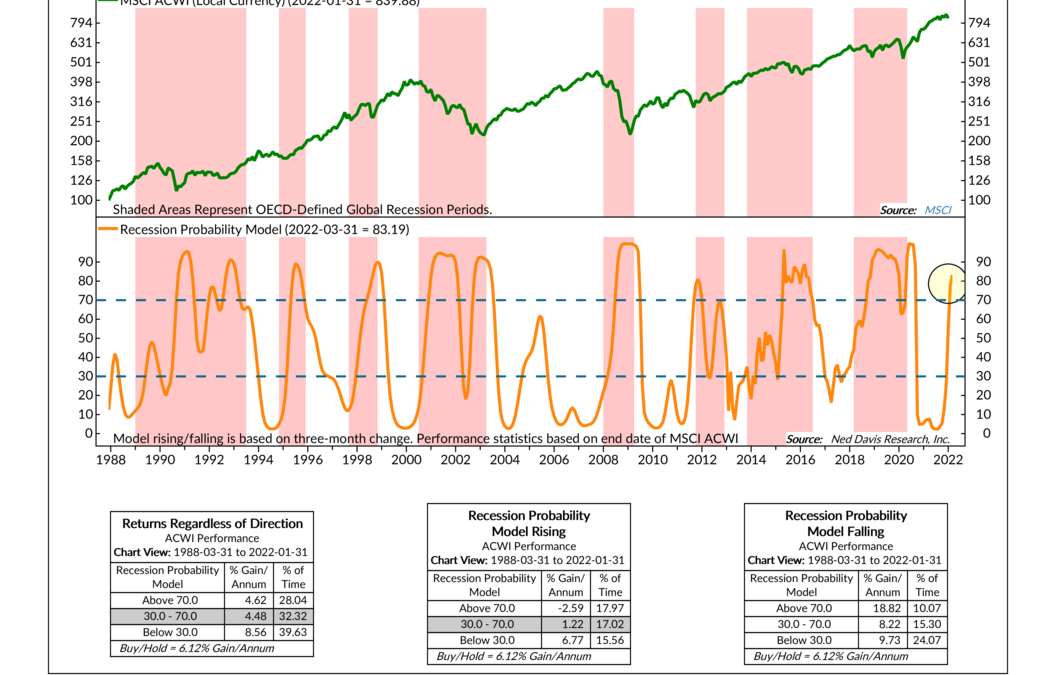
by NelsonCorp Wealth Management | Feb 24, 2022 | Indicator Insights
As with most things, recessions are a hard thing to predict. But, the good news is we have tools at our disposal that help us better understand when global economic slowdowns are occurring. Specifically, we utilize a global recession probability model, shown in...

by NelsonCorp Wealth Management | Feb 17, 2022 | Indicator Insights
When we measure what we call the “price movement” of the stock market, we look at more than just the price changes of a broad-market index like the S&P 500. Other price-related factors matter to stock price movements, as well. Breadth is one of those...
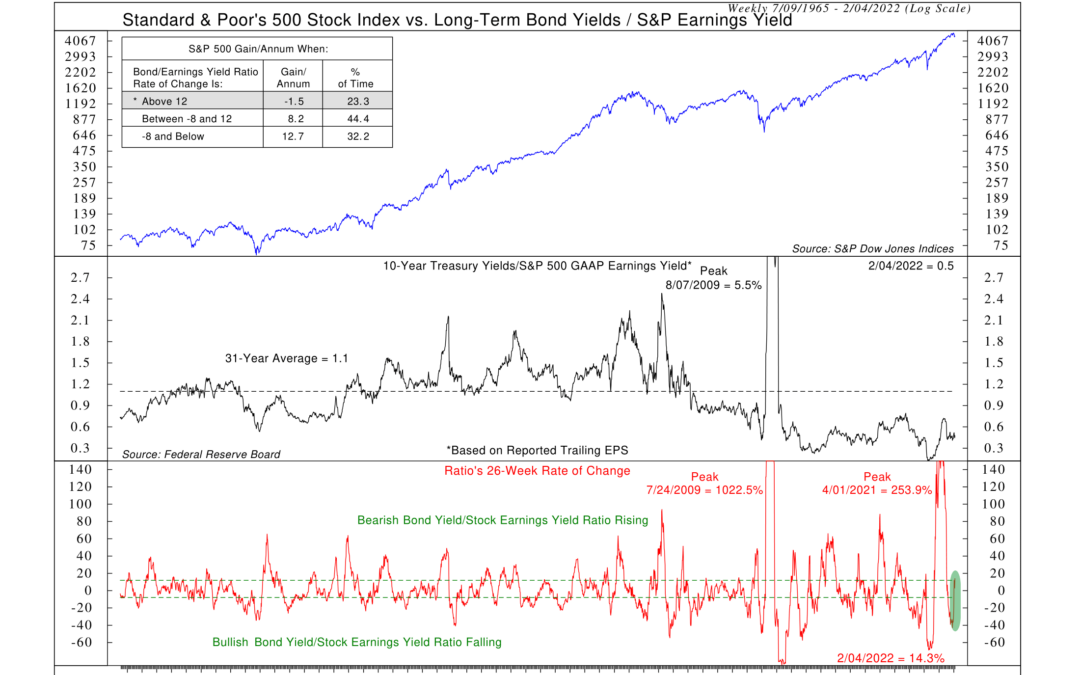
by NelsonCorp Wealth Management | Feb 10, 2022 | Indicator Insights
Often, when you hear people talking about the stock market being over or undervalued, they’re usually thinking about it in absolute terms. By that, I mean that they’ll look at a company and see that it’s earning, let’s say, $5 per share and that its stock is...
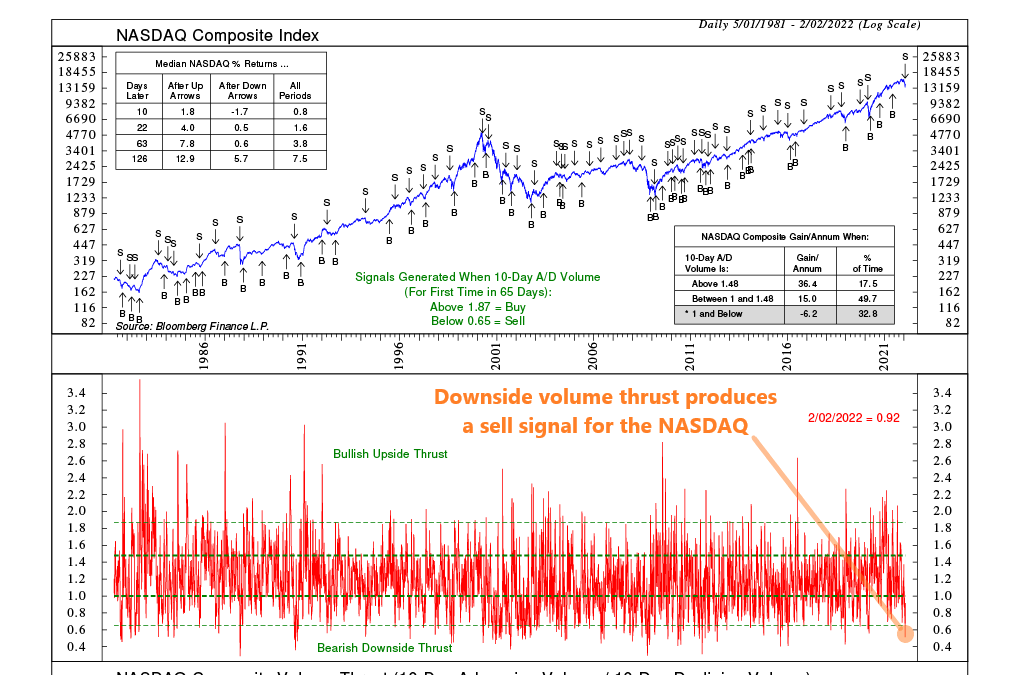
by NelsonCorp Wealth Management | Feb 3, 2022 | Indicator Insights
Sometimes the stock market moves forcefully in one direction, as a sudden surge of money elevates or depresses prices quickly. We can measure when this occurs via a technical tool called a thrust indicator. In general, a thrust indicator will measure market...
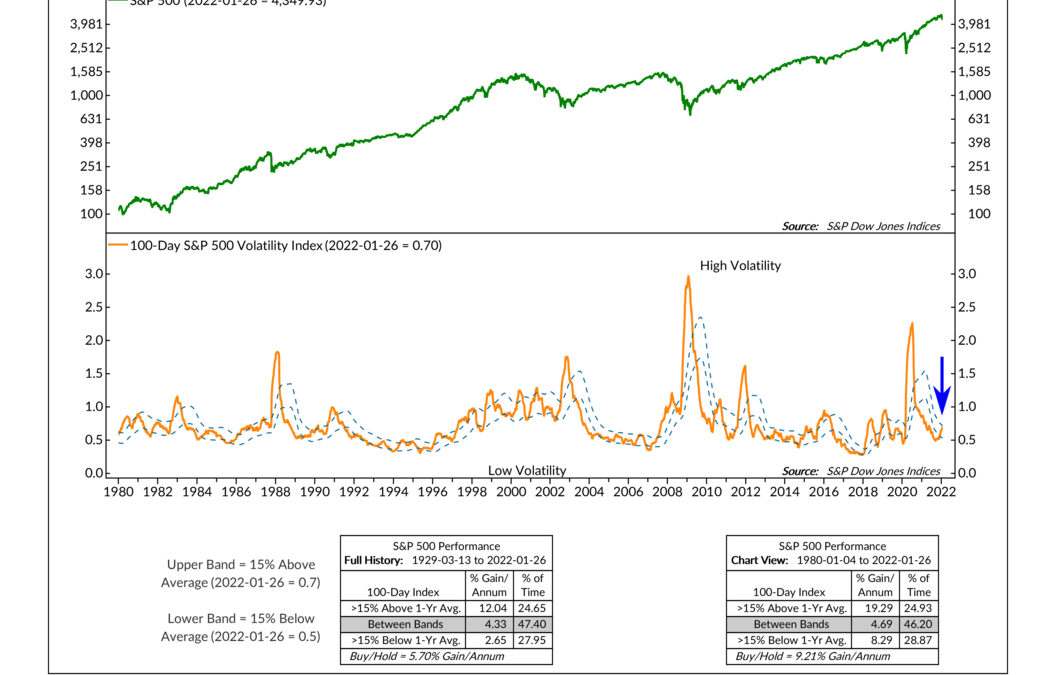
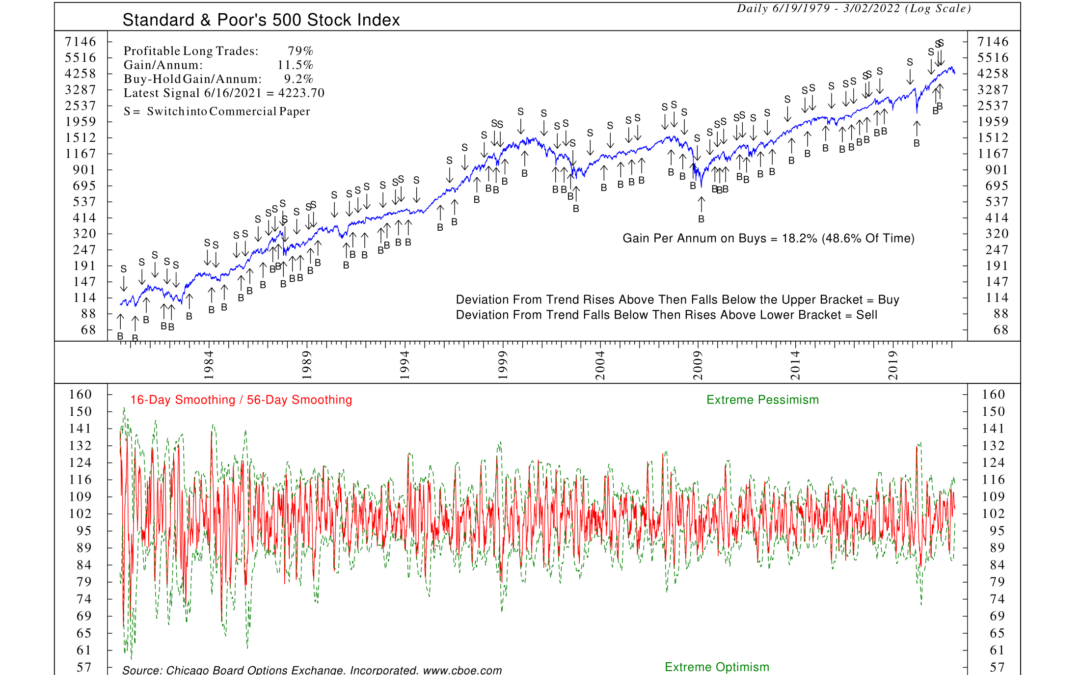
by NelsonCorp Wealth Management | Jan 27, 2022 | Indicator Insights
The stock market is volatile. Any investor will tell you as much. But the volatility of the stock market isn’t constant; it changes over time. The level of volatility at any given moment is dependent on the environment and the current mood of investors. In a...