
by NelsonCorp Wealth Management | Jan 6, 2022 | Indicator Insights
I like to think of this week’s featured indicator as a tug of war between the two major stock exchanges in North America: the Nasdaq and the New York Stock Exchange (NYSE). The relative differences between these two exchanges create a unique opportunity—which...

by NelsonCorp Wealth Management | Dec 30, 2021 | Indicator Insights
Our good old friend, the VIX Index, is the focus of our featured indicator this week. But what is the VIX Index, you might ask? It’s a real-time market index that uses option pricing on the S&P 500 Index to determine what market participants think...

by NelsonCorp Wealth Management | Dec 16, 2021 | Indicator Insights
The one sport in the Olympics that never ceases to amaze me when I see it is synchronized swimming, also known as water ballet. The way the athletes bob and weave through the water so effortlessly is pretty astonishing. I think it’s one of the most underrated...

by NelsonCorp Wealth Management | Dec 9, 2021 | Indicator Insights
When we model intermediate-term stock market risk, we break up the model into three major categories: Price Movements, Investor Sentiment, and the Economic Environment. Each of these three major categories is comprised of six sub-composites each (for a total of...
by NelsonCorp Wealth Management | Nov 30, 2021 | Indicator Insights
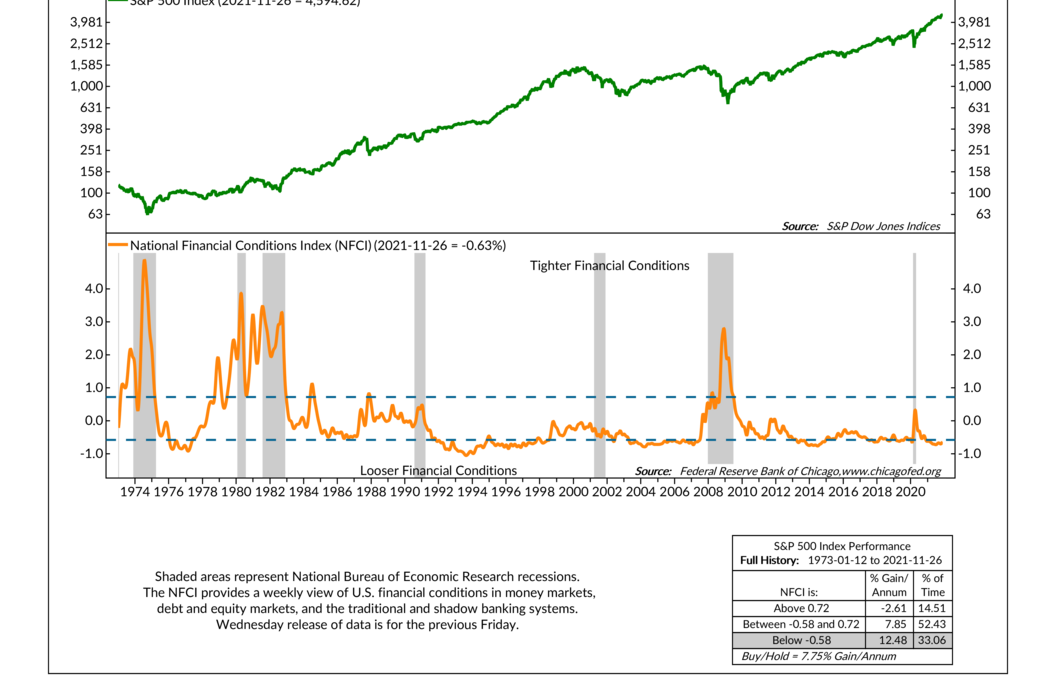
This week’s indicator focuses on the National Financial Conditions Index (NFCI) produced by the Chicago Federal Reserve. There are several “financial conditions” indexes out there, but the NFCI version includes a number of financial indicators (over 100)...
by NelsonCorp Wealth Management | Nov 18, 2021 | Indicator Insights
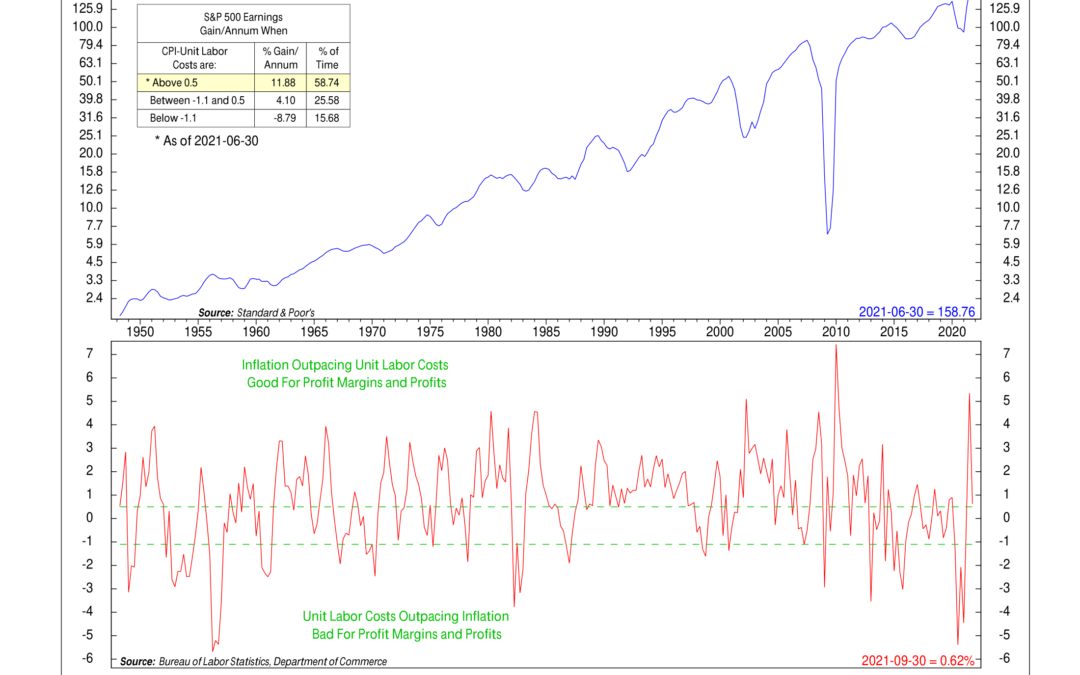
This week’s indicator is all about pricing power. When a company has pricing power, it can increase its prices and still maintain demand for its products. Whether or not a company can do this depends on various factors. But for many companies, labor is the...
