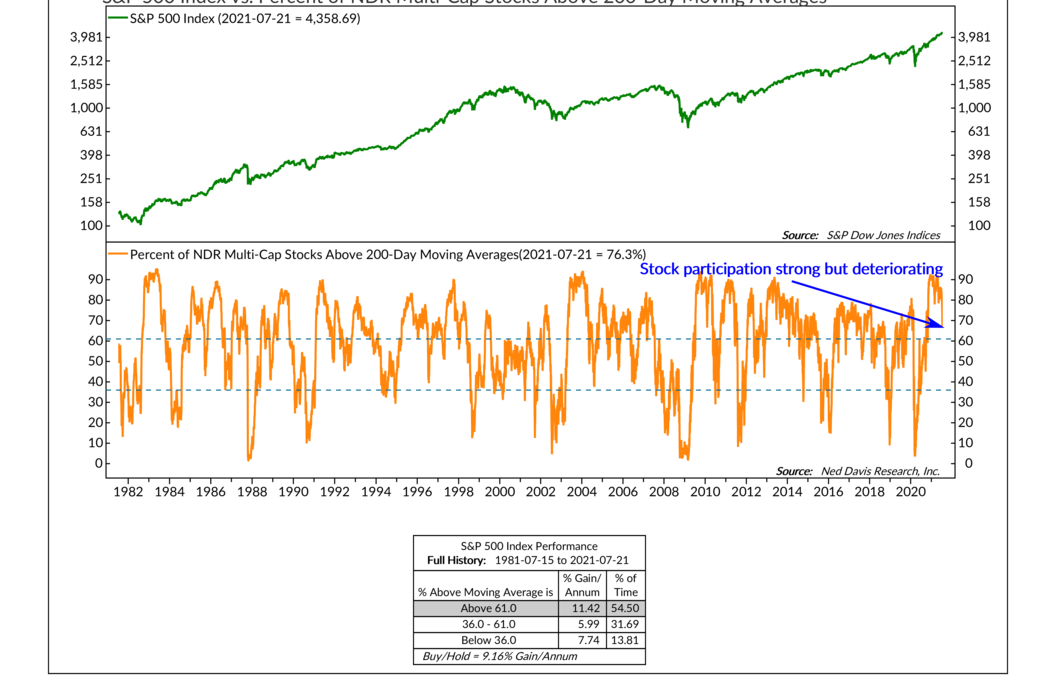
by NelsonCorp Wealth Management | Jul 22, 2021 | Indicator Insights
This week’s indicator is based on the idea that the more stocks participating in a rally, the better. To find this level of participation or breadth, we use a technical tool called a 200-day moving average. When applied to the price of a stock, for example, the...
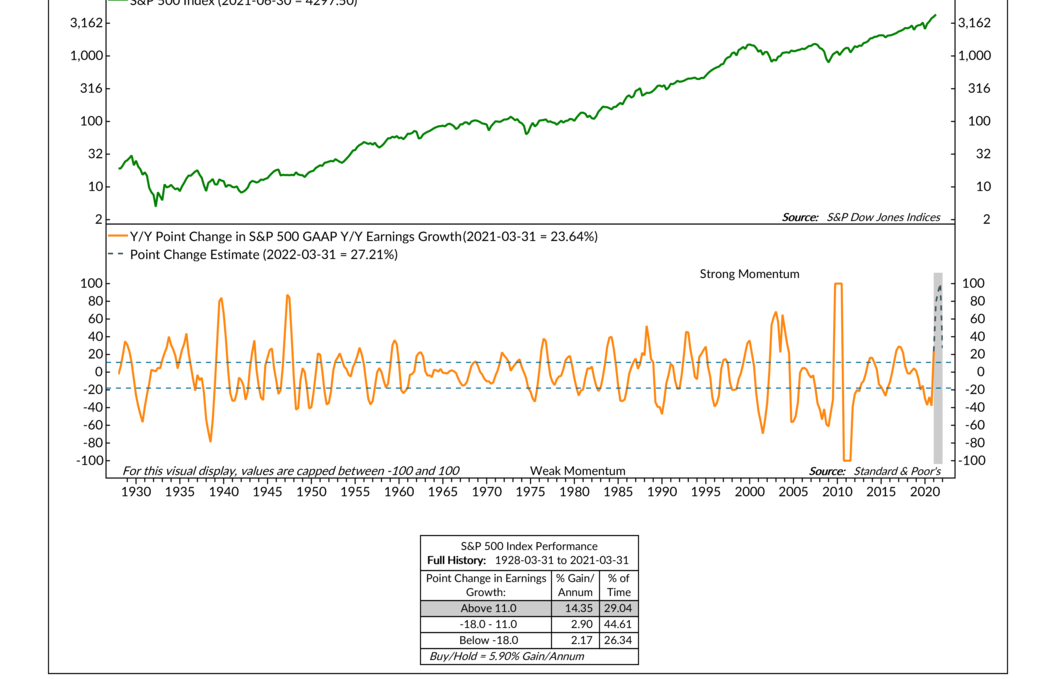
by NelsonCorp Wealth Management | Jul 15, 2021 | Indicator Insights
Let’s say you have some money saved up, and you want to put that money to work as an investment. One option you have is to buy stock issued by publicly traded companies. The idea, of course, is that the shares of stock you buy will appreciate as time goes on,...
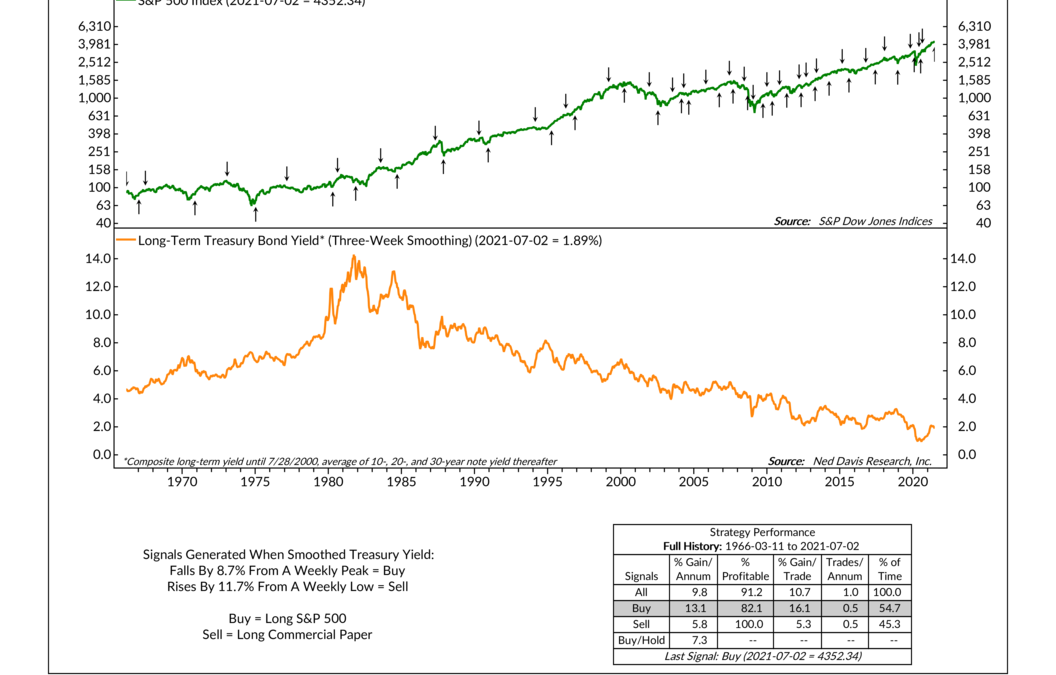
by NelsonCorp Wealth Management | Jul 8, 2021 | Indicator Insights
In previous blog posts, we’ve talked about how interest rate trends affect stock prices. In general, we’ve found that rising rates tend to be bad for stocks and vice versa. But there are various lengths or maturities of interest rates. Some would argue that...
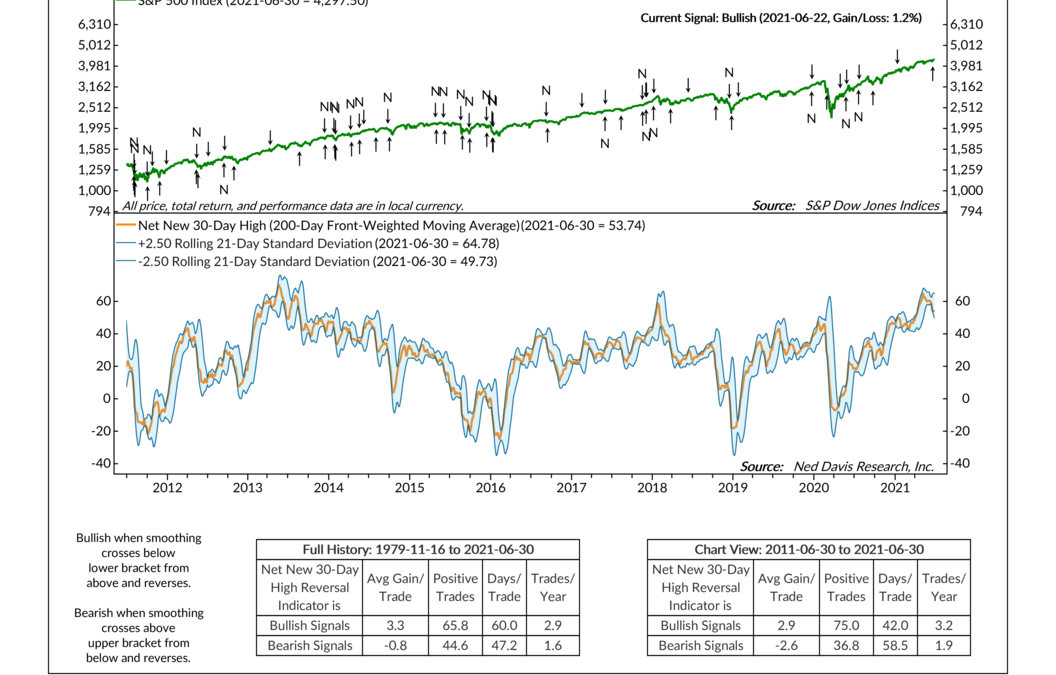
by NelsonCorp Wealth Management | Jul 1, 2021 | Indicator Insights
Here’s a stock market trading strategy: Buy rising stocks and sell falling stocks. It’s simple. It makes sense. But it’s easier said than done. Enter our featured indicator of the week. It executes this simple trading strategy in a more rigorous and analytical...
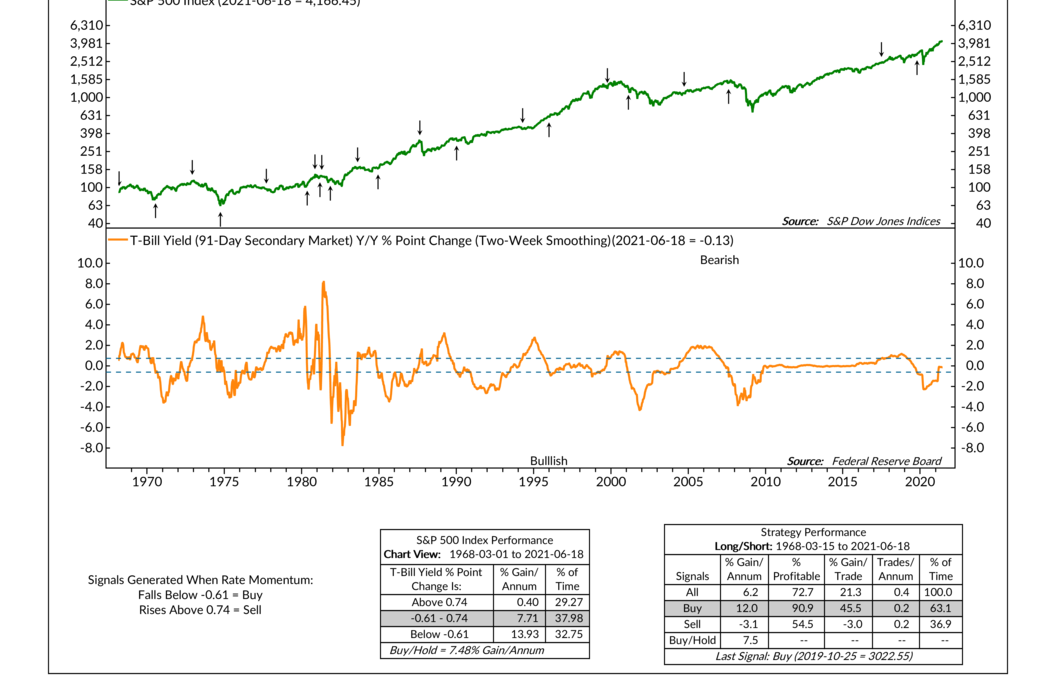
by NelsonCorp Wealth Management | Jun 24, 2021 | Indicator Insights
Interest rates matter for stock prices. This is something you hear all the time in the financial ecosystem. But not all interest rates are created equal. So, for this week’s featured indicator, we focus on a very short-term type of interest rate—called a T-Bill...
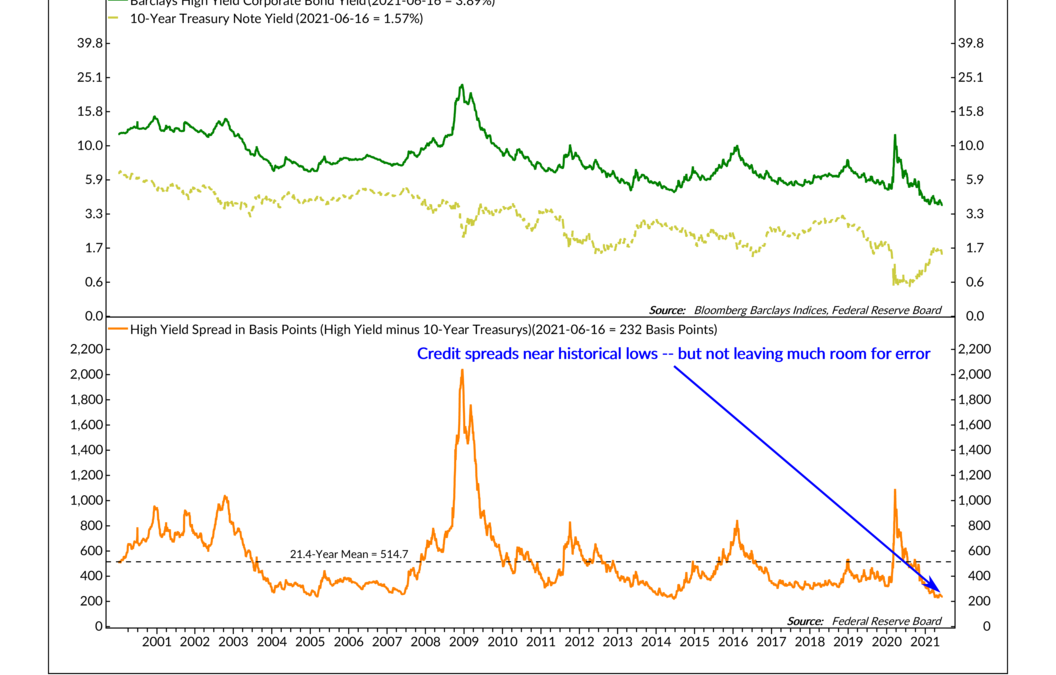
by NelsonCorp Wealth Management | Jun 17, 2021 | Indicator Insights
This week we look at what we call a “credit spread” indicator. A credit spread indicator gets its name from the fact that it measures the difference between a safe asset, like a U.S. Treasury bond, and a debt security of the same maturity but with lower credit...