by NelsonCorp Wealth Management | Feb 10, 2022 | Indicator Insights
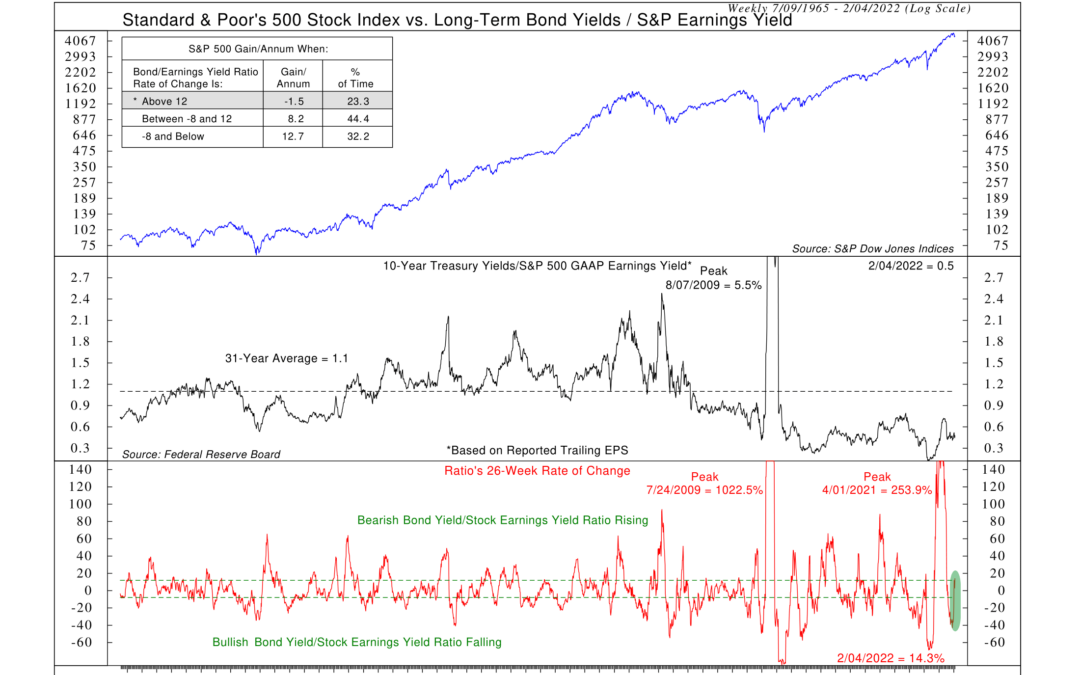
Often, when you hear people talking about the stock market being over or undervalued, they’re usually thinking about it in absolute terms. By that, I mean that they’ll look at a company and see that it’s earning, let’s say, $5 per share and that its stock is...
by NelsonCorp Wealth Management | Feb 3, 2022 | Indicator Insights
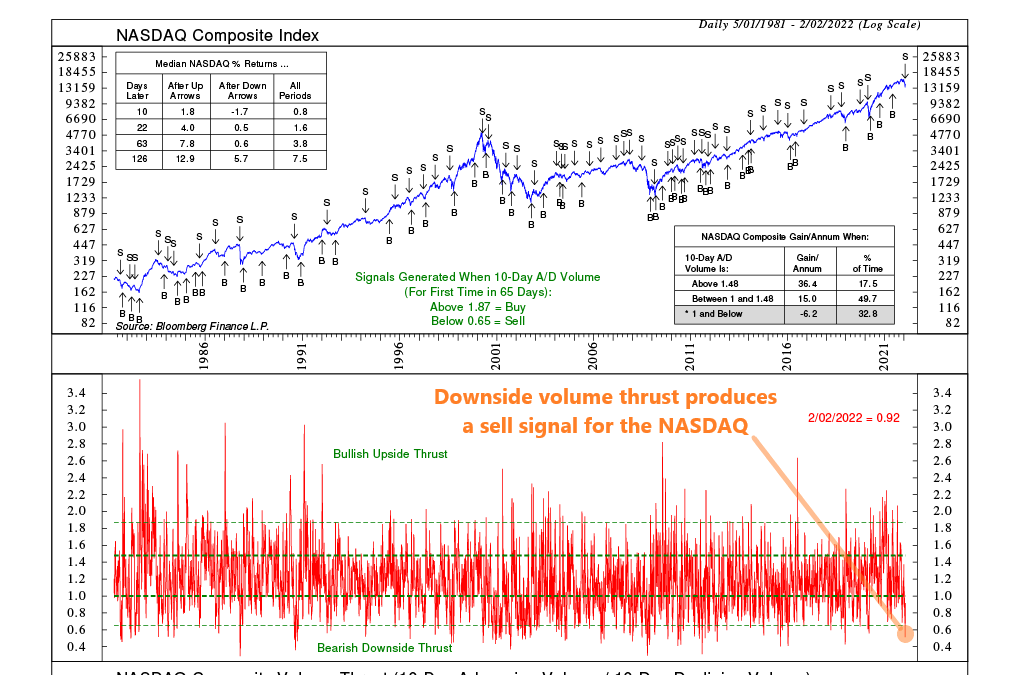
Sometimes the stock market moves forcefully in one direction, as a sudden surge of money elevates or depresses prices quickly. We can measure when this occurs via a technical tool called a thrust indicator. In general, a thrust indicator will measure market...
by NelsonCorp Wealth Management | Jan 27, 2022 | Indicator Insights
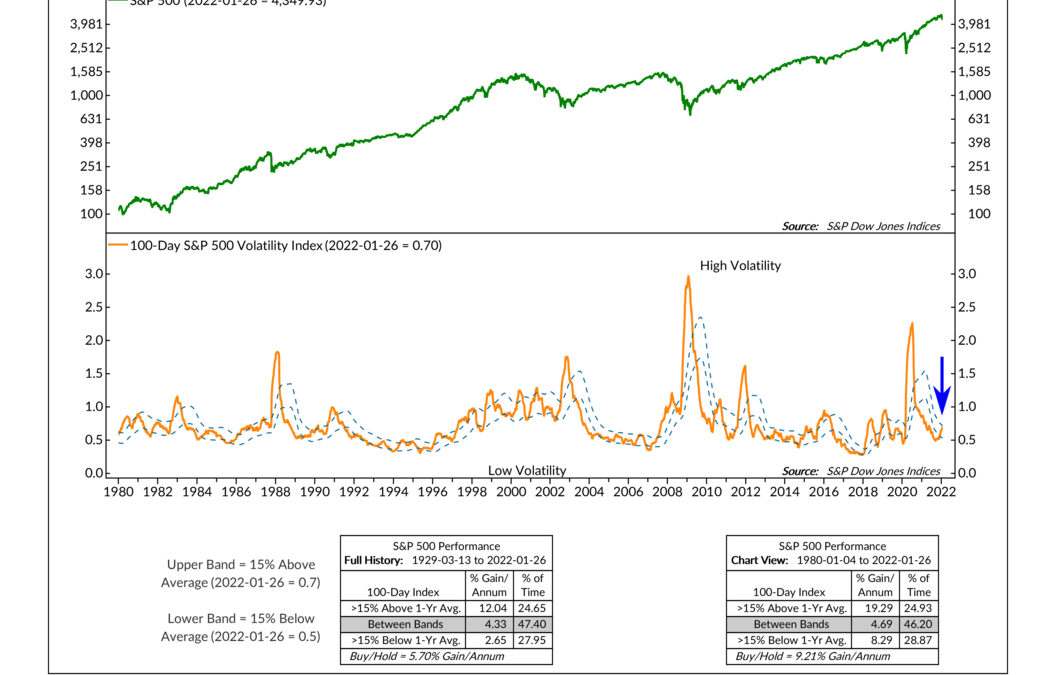
The stock market is volatile. Any investor will tell you as much. But the volatility of the stock market isn’t constant; it changes over time. The level of volatility at any given moment is dependent on the environment and the current mood of investors. In a...
by NelsonCorp Wealth Management | Jan 20, 2022 | Indicator Insights
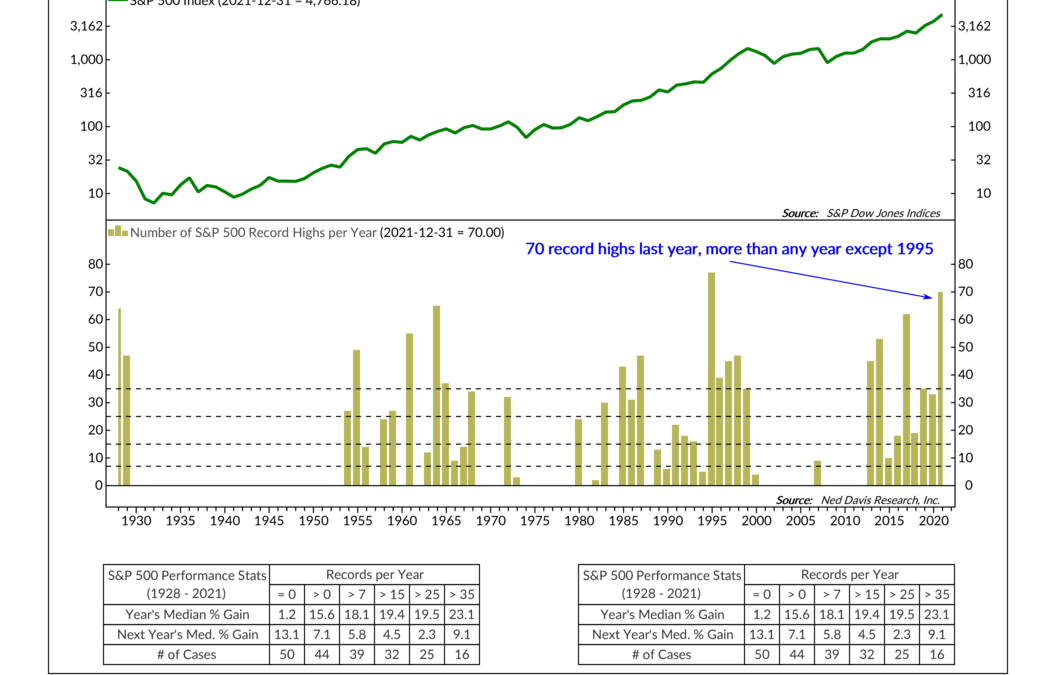
This week I want to drill down a little deeper on a chart that we highlighted around the middle of last year. It’s the number of record highs attained by the S&P 500 stock market index per year, going back to 1928. I bring this chart up because, as you can...

by NelsonCorp Wealth Management | Jan 14, 2022 | Indicator Insights
The primary goal of any business is to make a profit; or, at the very least, profits validate a business’s commercial endeavors. So, for this week’s chart, we show the profit margin of S&P 500 companies over the past 50 years. As you can see on the far...

by NelsonCorp Wealth Management | Jan 13, 2022 | Indicator Insights
The one thing made apparent last year is that liquidity matters to the stock market. By liquidity, we mean the amount of available money sloshing around the economy; when it’s excessive, it tends to find its way into financial assets—like stocks. One of the...
