by NelsonCorp Wealth Management | Sep 22, 2022 | Indicator Insights
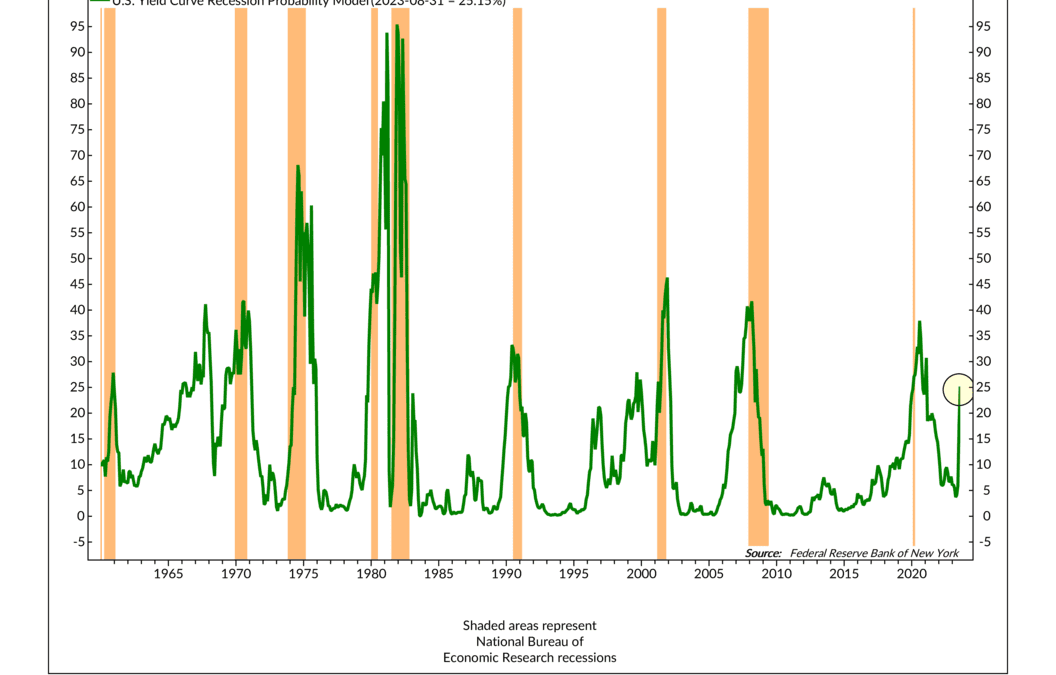
This week’s indicator looks at the yield curve and how its shape can be used to anticipate when an economic recession is becoming more likely. The portion of the yield curve that it focuses on is the 10-year Treasury rate and the 3-month Treasury rate. The New...

by NelsonCorp Wealth Management | Sep 19, 2022 | Weekly Market Thoughts
OVERVIEW It was another rough week for the U.S. stock market. All three benchmark stock indices posted losses. The S&P 500 declined 4.8%, its worst week since mid-June. The Dow Jones Industrial Average lost 4.1%, and the Nasdaq Composite slid 5.5%....

by NelsonCorp Wealth Management | Sep 16, 2022 | Chart of the Week
Inflation has been a thorn in the side of the stock market all year. This week, we found out that the Consumer Price Index (CPI)—a commonly used measure of inflation—dropped to an 8.3% year-over-year rate in August versus the 8.52% rate in July and the 9.06%...

by NelsonCorp Wealth Management | Sep 15, 2022 | Indicator Insights
This week’s featured indicator examines the relationship between stock performance and inflation in the U.S. The indicator uses two main inputs: the year-to-year change in the Consumer Price Index (CPI) and the six-month smoothing or average of the CPI....
by NelsonCorp Wealth Management | Sep 12, 2022 | Weekly Market Thoughts
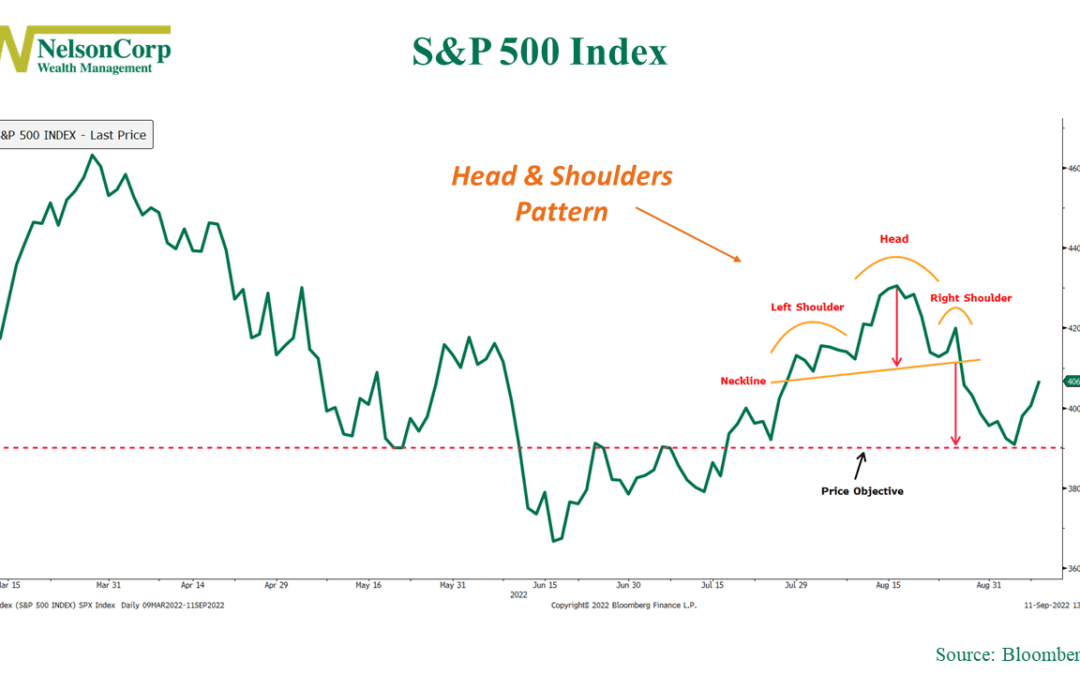
OVERVIEW The U.S. stock market snapped a three-week losing streak on a holiday-shortened week last week. The S&P 500 gained 3.65%, the Dow Jones Industrial Average rose 2.66%, and the Nasdaq Composite popped 4.14%. Growth stocks led the way, gaining 4.11%....
