by NelsonCorp Wealth Management | Sep 9, 2022 | Chart of the Week
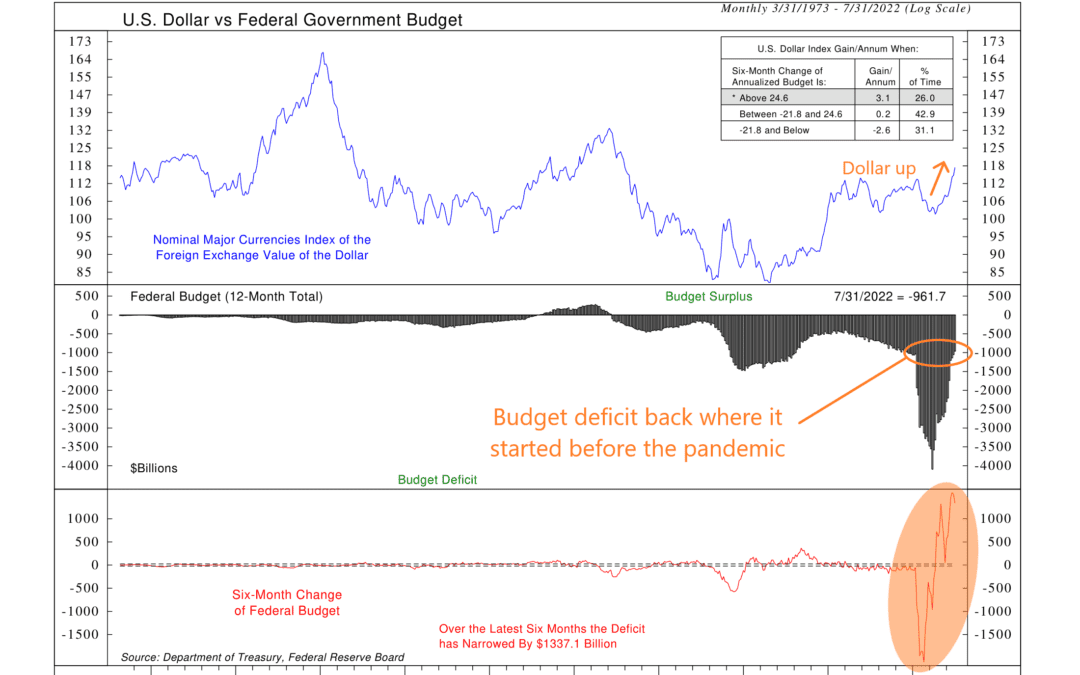
This week’s chart shows the change in the U.S. federal budget going back to 1973. In the middle clip, we have the rolling 12-month total federal budget, with positive values indicating a budget surplus and negative values indicating a budget deficit. The red...
by NelsonCorp Wealth Management | Sep 8, 2022 | Indicator Insights
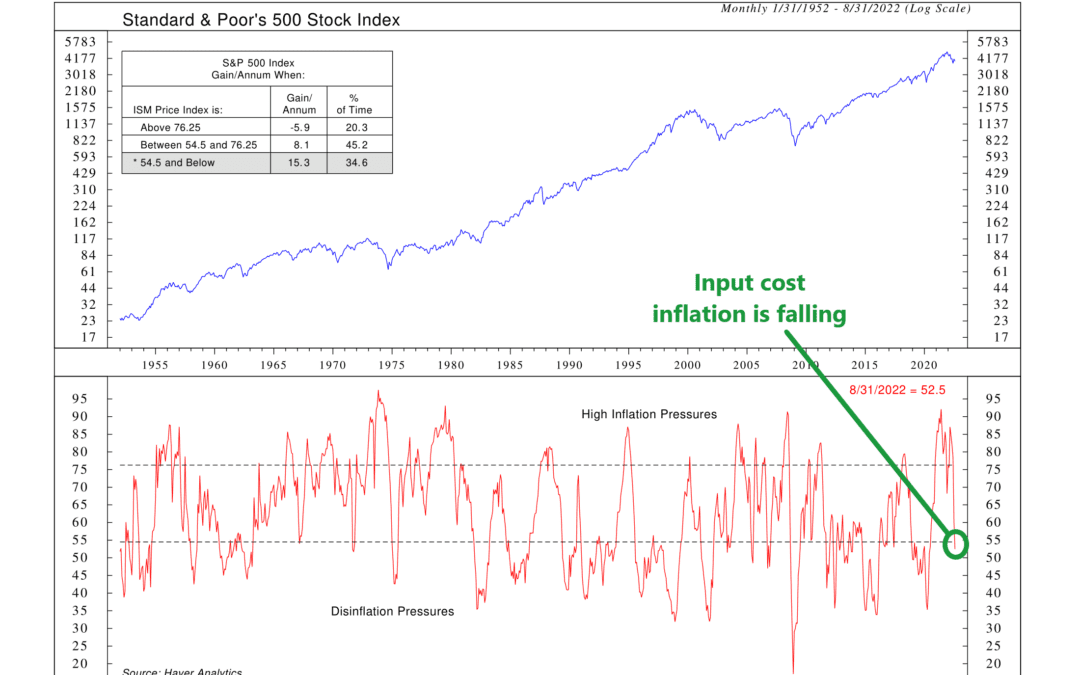
Every month, the Institute of Supply Management (ISM) conducts surveys of purchasing managers at hundreds of manufacturing firms in the U.S. and compiles the results into an index. Among the various sub-indices in the report is an index that measures the prices...
by NelsonCorp Wealth Management | Sep 6, 2022 | Weekly Market Thoughts
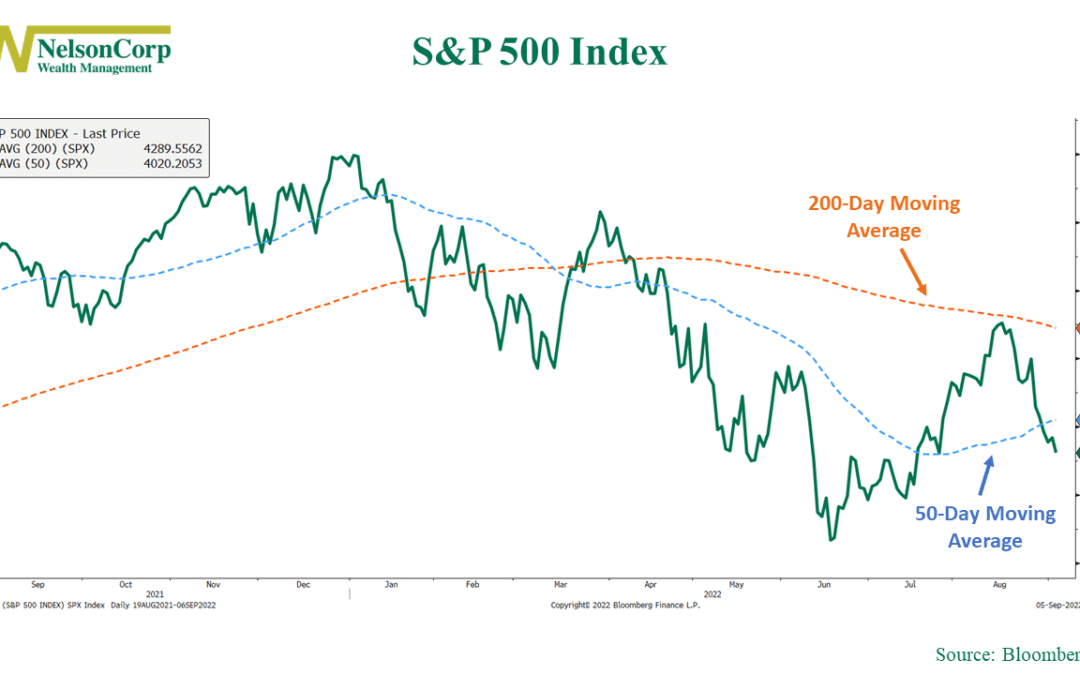
OVERVIEW The U.S. stock market continued to sell off last week, with the S&P 500 falling 3.29%, the Dow Jones Industrial Average dropping 2.99%, and the Nasdaq Composite plunging 4.21%. Foreign stocks slipped up as well. Developed country stocks fell 3.13%,...
by NelsonCorp Wealth Management | Sep 2, 2022 | Chart of the Week
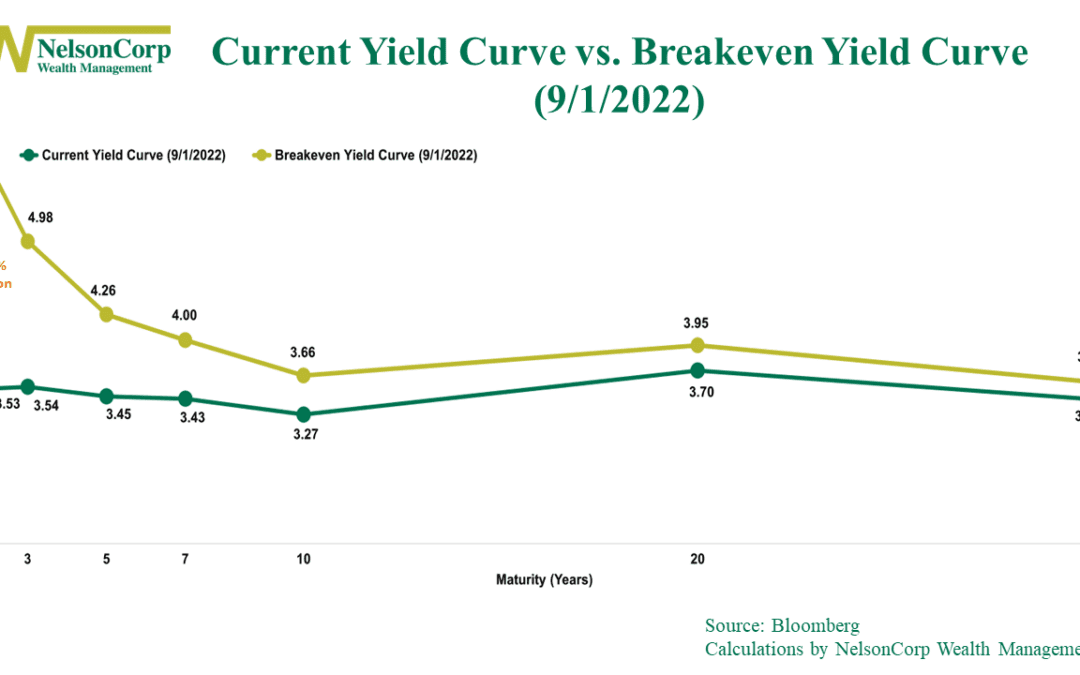
The 2-year Treasury note’s yield made the news this week when it rose to roughly 3.5%, its highest level since 2007. This is significant because it is currently one of the highest yielding bonds on the Treasury yield curve, shown as the green line on the chart...
by NelsonCorp Wealth Management | Sep 1, 2022 | Indicator Insights
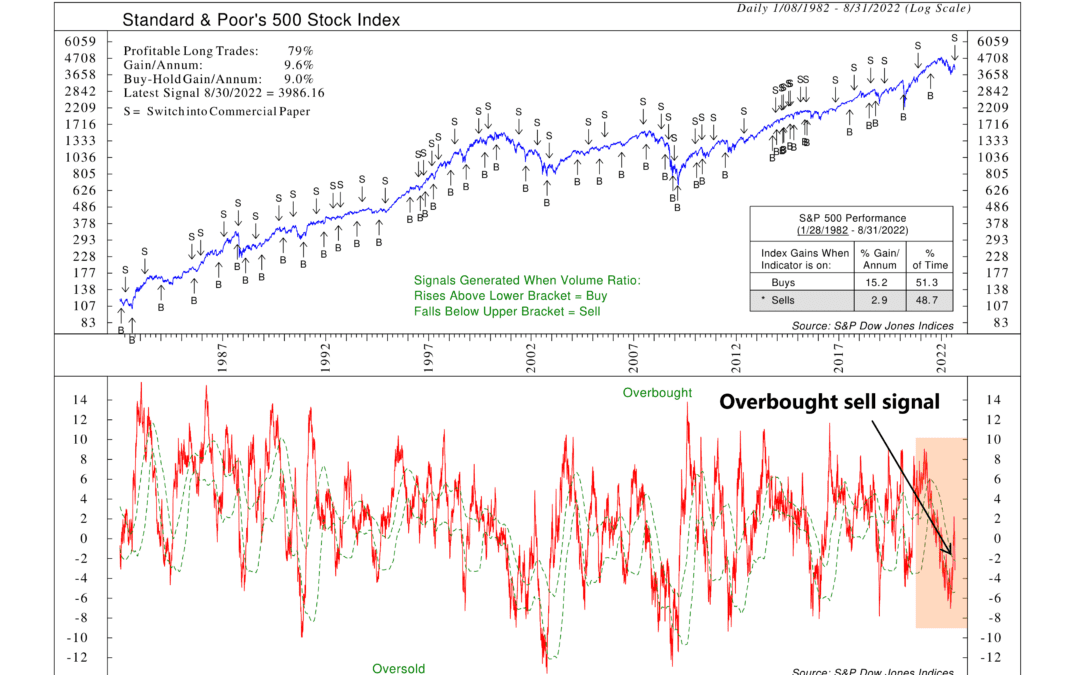
Volume—or the number of shares traded in the stock market—is an important metric for financial markets. We look at volume because, in general, when a rising stock has a lot of volume, it’s a sign of strength. But when the stock is falling on a lot of volume, it...
