by NelsonCorp Wealth Management | Aug 29, 2022 | Weekly Market Thoughts
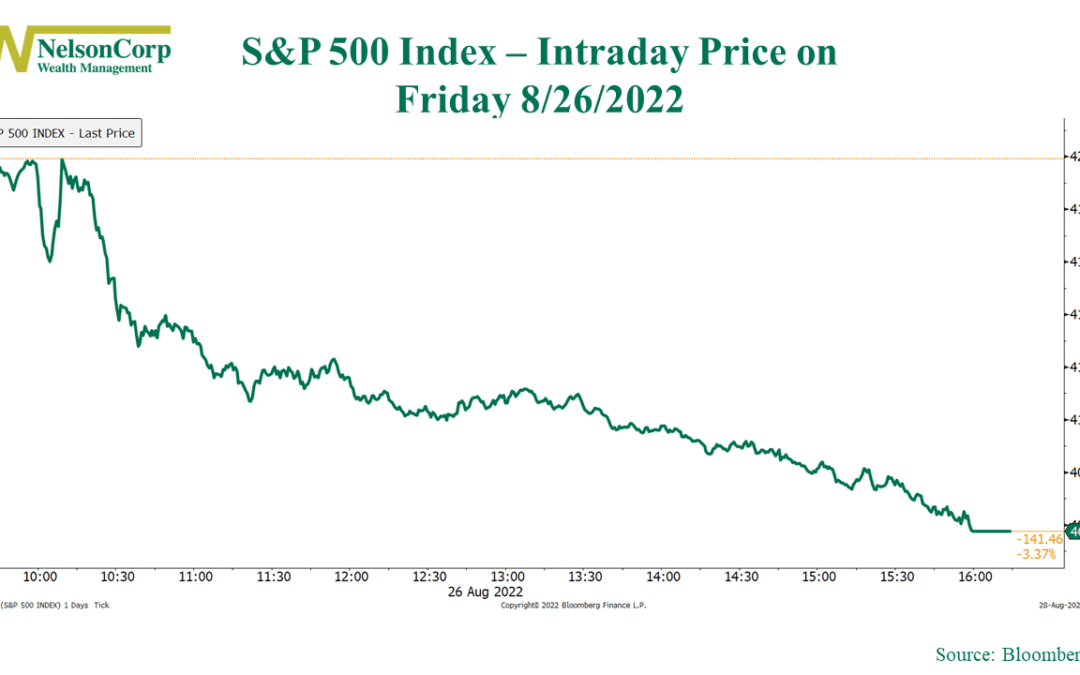
OVERVIEW The major U.S. stock market indices ended the week down over 4% after Fed Chair Jerome Powell delivered a hawkish speech at the Jackson Hole event on Friday. The S&P 500 Index fell 4.04%, the Dow Jones Industrial Average dropped 4.22%, and the...
by NelsonCorp Wealth Management | Aug 26, 2022 | Chart of the Week
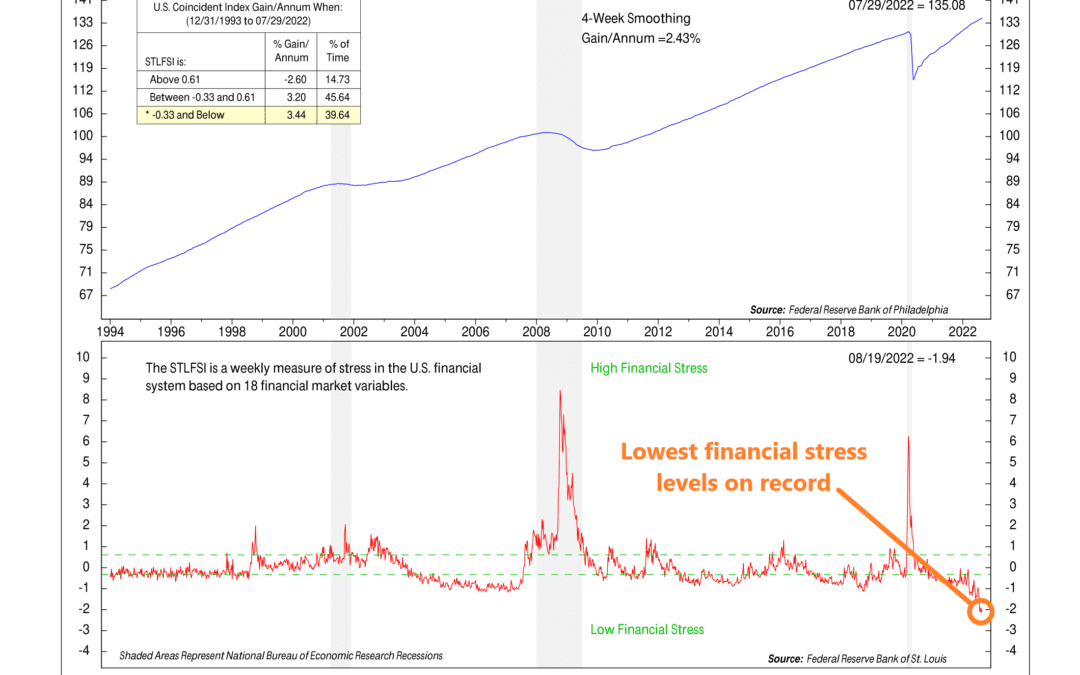
This week’s chart is the St. Louis Financial Stress Index. It was first published by the Federal Reserve Bank of St. Louis in 2010—with data going back to 1993—to better gauge levels of financial stress in the system in the aftermath of the 2008 financial...
by NelsonCorp Wealth Management | Aug 25, 2022 | Indicator Insights
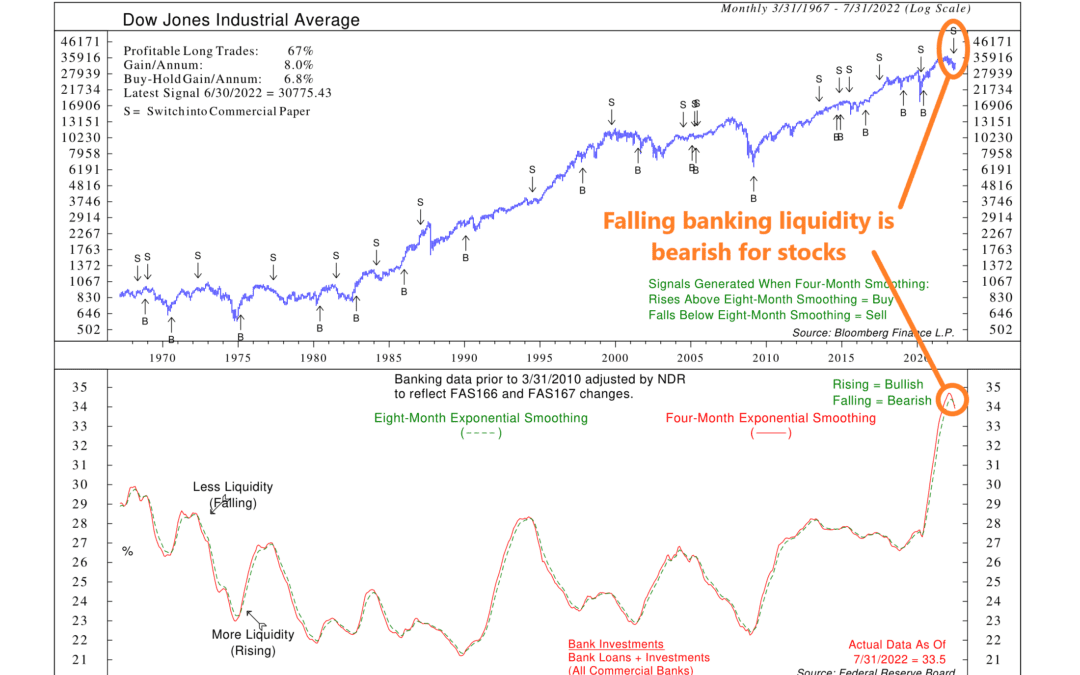
This week’s featured indicator looks at banking liquidity and how it affects stock market performance over time. The core idea is that a rising trend in liquidity is bullish for the stock market because it reduces pressure on interest rates. Falling liquidity,...
by NelsonCorp Wealth Management | Aug 22, 2022 | Weekly Market Thoughts
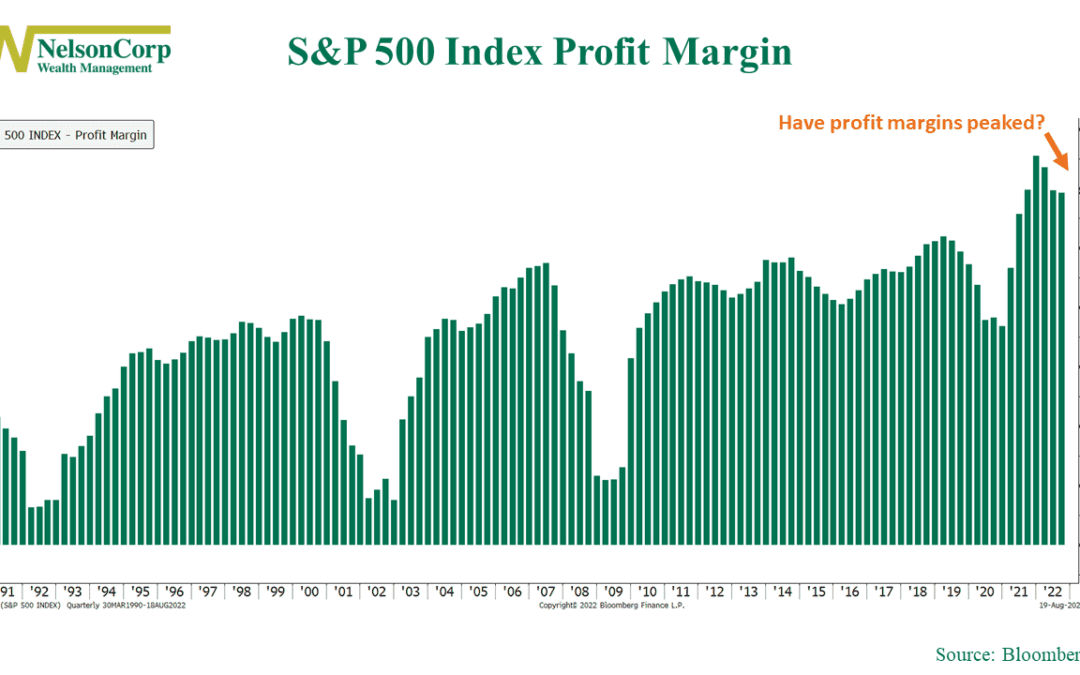
OVERVIEW The U.S. stock market slipped last week and ended in negative territory, resulting in the S&P 500 snapping its four-week winning streak. The Dow Jones Industrial Average decreased 0.16%, the Nasdaq Composite declined 2.62%, and the S&P 500...
by NelsonCorp Wealth Management | Aug 19, 2022 | Chart of the Week
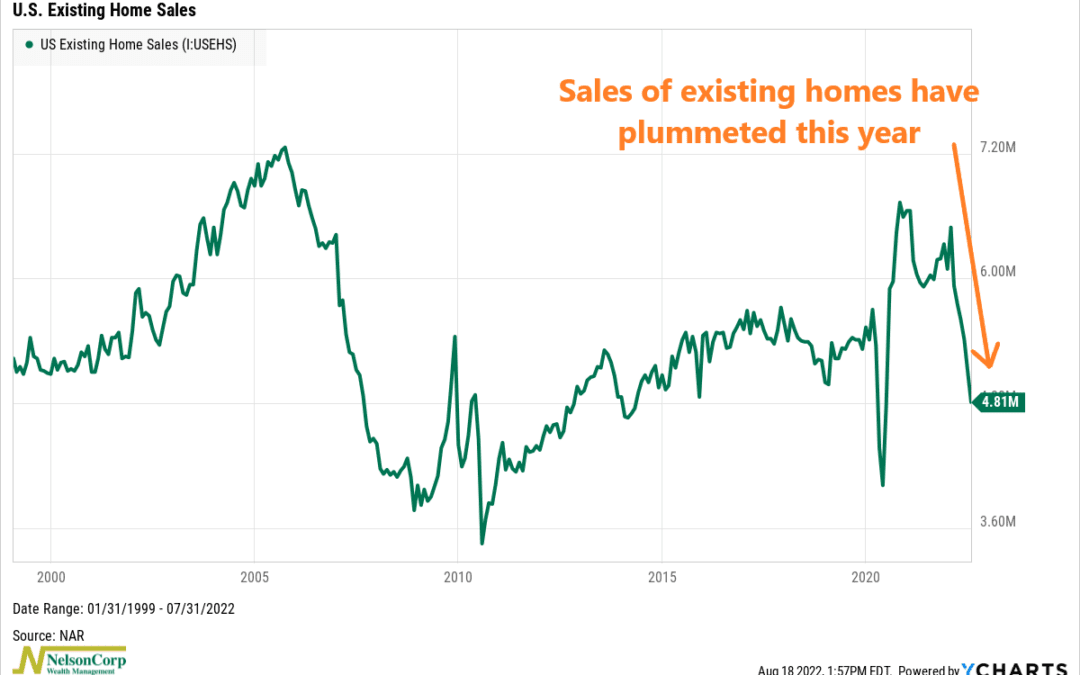
This week’s chart shows existing home sales in the United Sales going back to 1999. It tells us how many homes were sold each month—but only for homes that were already owned and occupied before coming onto the market. As you can see, they have crashed this...
