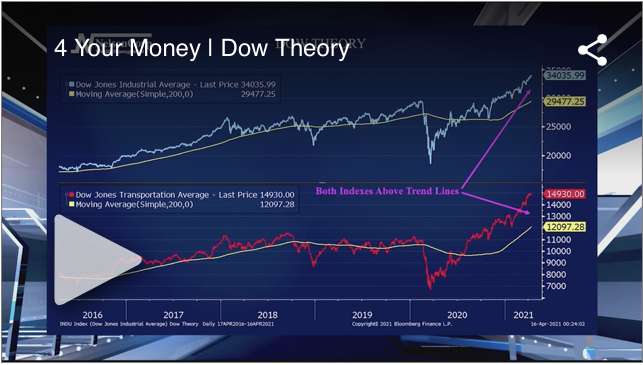
Dow Theory
A key pillar of 4 Your Money is the concept of risk management and all of the data considered to understand risk. David Nelson joins the Local 4 News team today to share why price is such an important metric when measuring risk.
Flush with Cash
OVERVIEW U.S. stocks took a slight step back last week, with the S&P 500 dropping 0.13%, the Dow falling 0.46%, and the Nasdaq declining 0.25%. Small-cap and mid-cap stocks, however, rose 0.16% and 0.91%, respectively. Value stocks also edged higher by...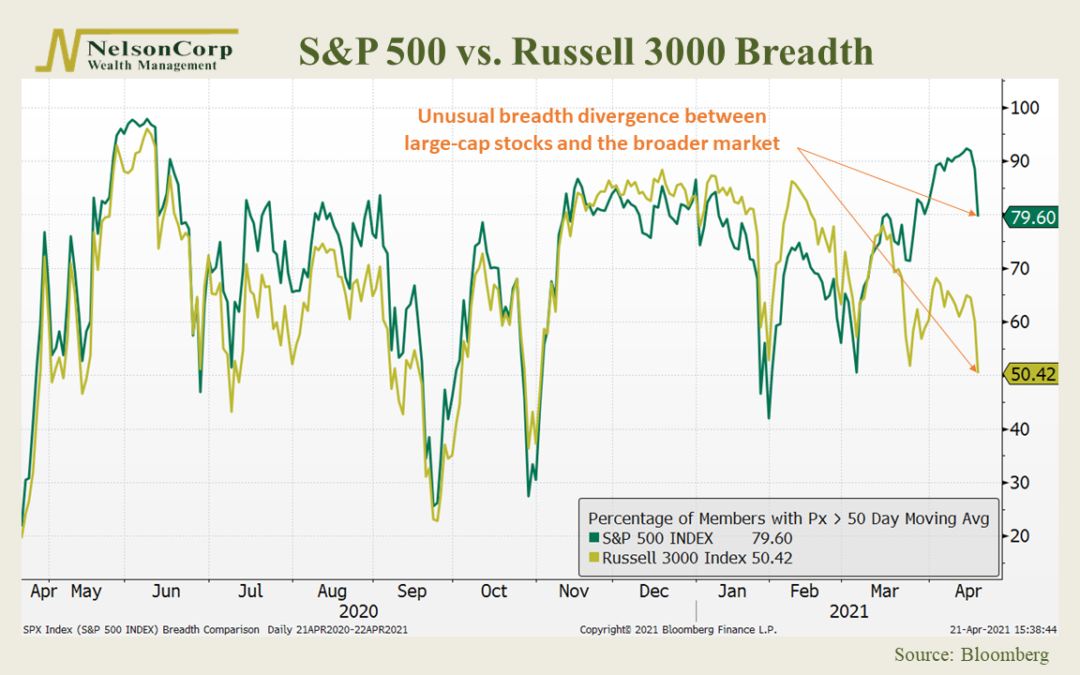
Out of Sync
This week’s featured chart looks at stock market breadth in the United States. Specifically, we focus on two major U.S stock indices. You may already be familiar with the first, the S&P 500, representing the 500 largest stocks by market capitalization in...