
by NelsonCorp Wealth Management | May 26, 2022 | Indicator Insights
When a bank makes a loan, it provides money for commerce and greases the gears of our economic machine. But this increased liquidity for the economy does not necessarily translate into increased liquidity for the stock market. Why? Because banks typically do...

by NelsonCorp Wealth Management | May 19, 2022 | Indicator Insights
When you look at a graph of the stock market, or, more specifically, an index of stocks—like a global stock market index—you notice that it tends to travel in trends over time. Sometimes it trends up, and sometimes it trends down. Coming out of the pandemic...
by NelsonCorp Wealth Management | May 12, 2022 | Indicator Insights
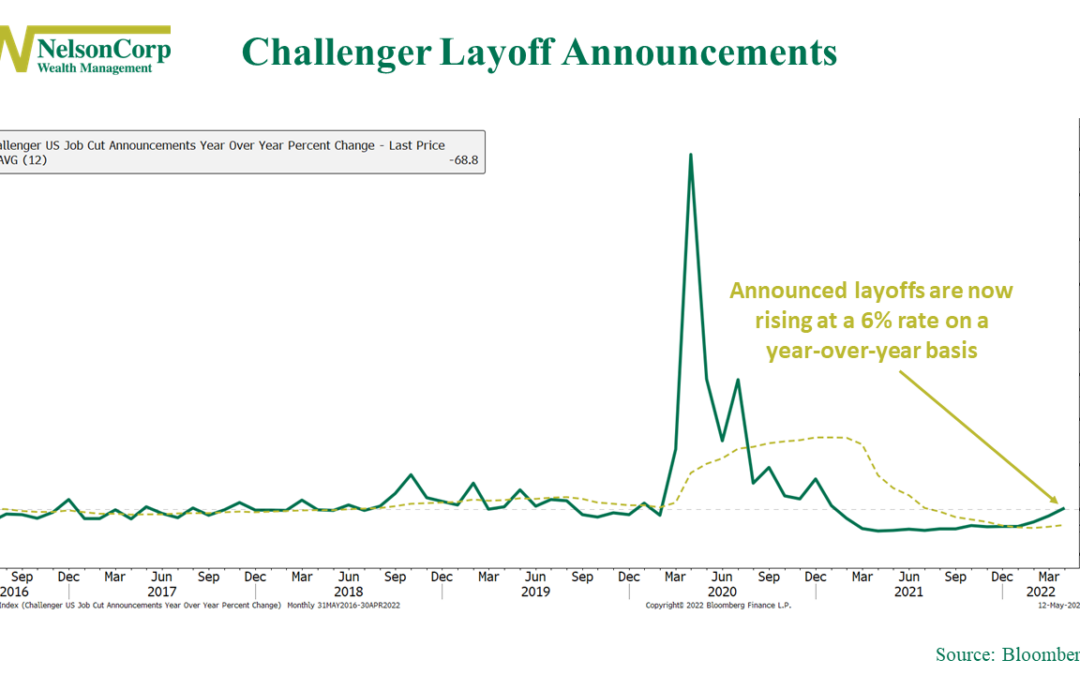
According to the most recent report from the outplacement firm Challenger, Grey & Christmas, Inc., U.S.-based employers announced 24,286 layoffs in April. This was 14% higher than the 21,387 announced in March and up 6% from the 22,913 cuts announced a year...
by NelsonCorp Wealth Management | May 5, 2022 | Indicator Insights
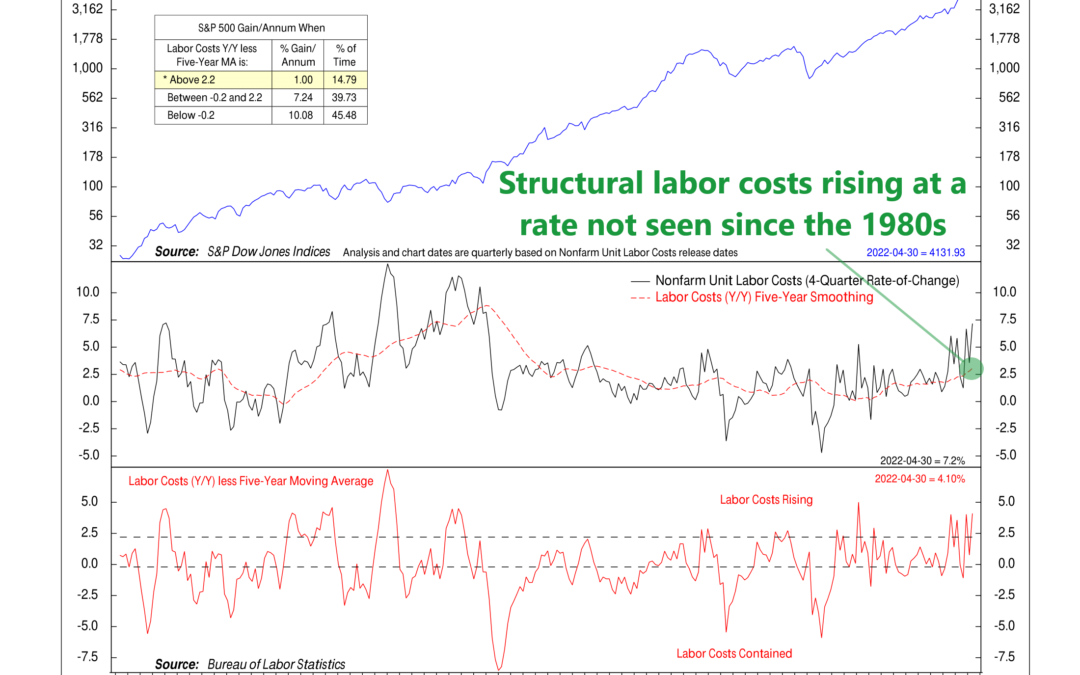
For this week’s indicator, we focus on nonfarm unit labor costs. The biggest expense for most businesses is labor. And one way to measure the cost of labor is by looking at unit labor costs, or how much a firm pays its workers to produce one unit of output. In...
by NelsonCorp Wealth Management | Apr 28, 2022 | Indicator Insights
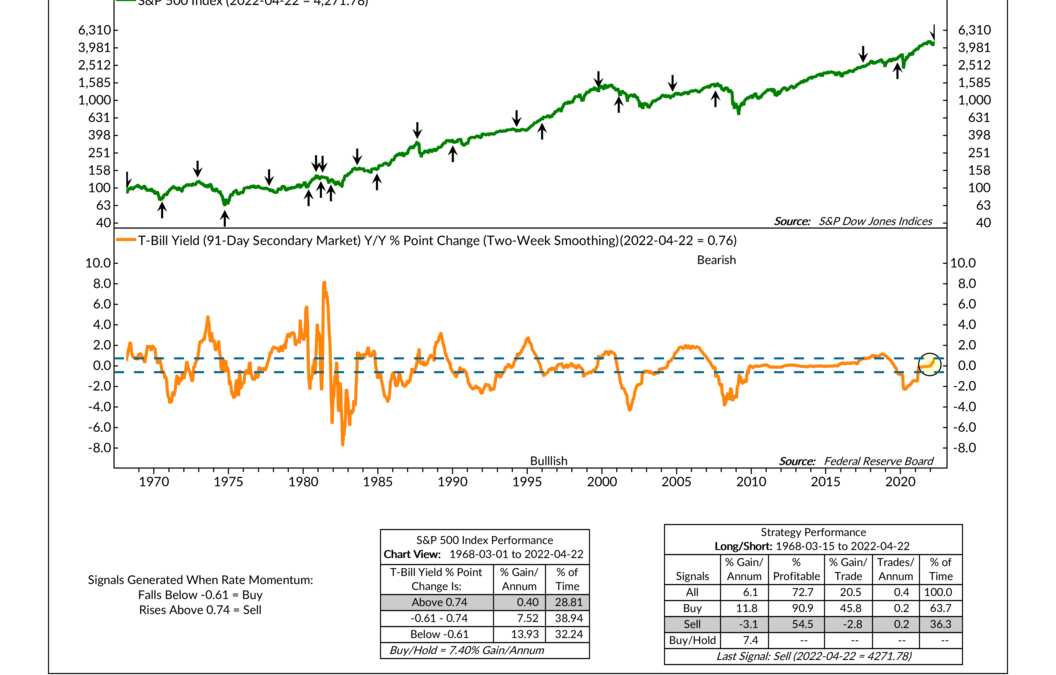
Last week, I discussed this idea that short-term interest rates are surging, putting pressure on stocks. So, this week, I want to show the specific indicator that we use to measure short-term interest rate momentum, or what I’ll call T-Bill Yield Momentum. A...
by NelsonCorp Wealth Management | Apr 21, 2022 | Indicator Insights
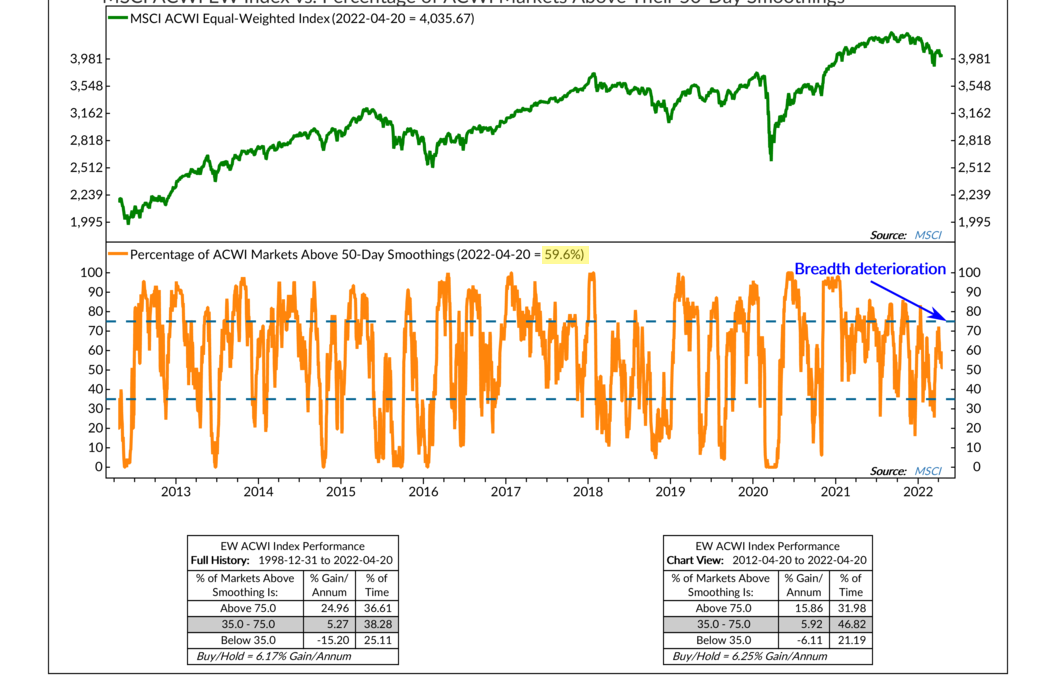
We’ve recently talked about this idea of participation—or lack thereof—in the stock market. One way to measure participation is to look at a stock index and calculate what percentage of the individual stocks are performing well. When this number is high, we say...