
by NelsonCorp Wealth Management | Oct 20, 2022 | Indicator Insights
When it comes to generating income in retirement, an investor has two primary choices: stocks and bonds. A bond is straightforward; the income comes from the bond’s yield. On the other hand, stocks throw off dividends, which have the potential to be lucrative...
by NelsonCorp Wealth Management | Oct 13, 2022 | Indicator Insights
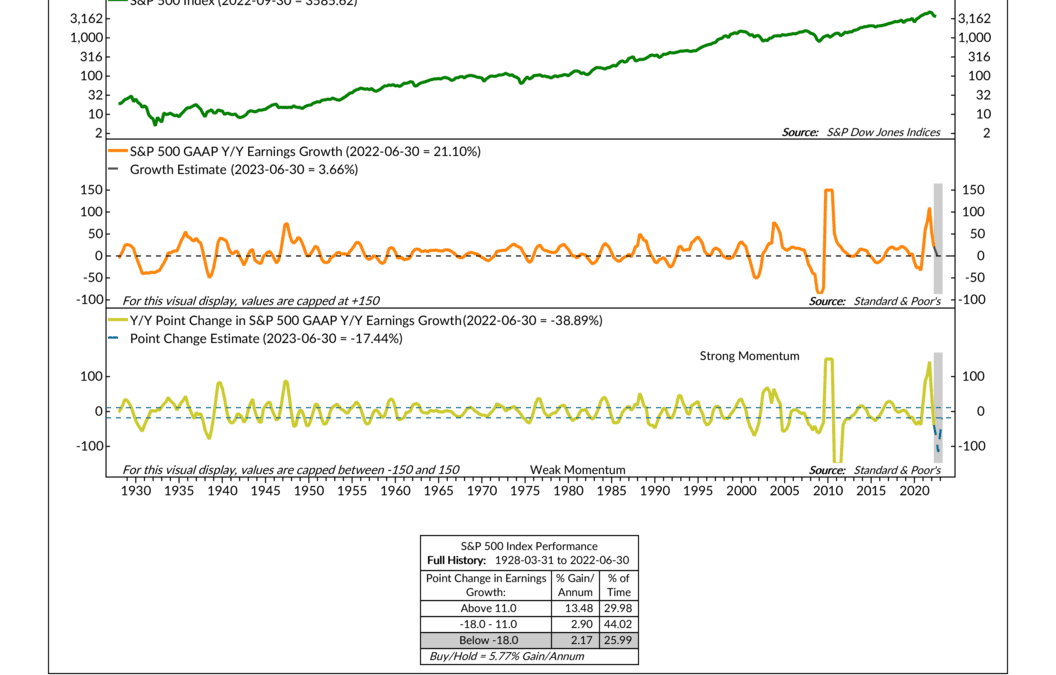
Earnings are an important driver of stock market returns. But the stock market is a complicated beast—it doesn’t just trade off earnings growth alone. The key insight of this week’s featured indicator is that the market trades off the change in the...

by NelsonCorp Wealth Management | Oct 6, 2022 | Indicator Insights
This week’s featured indicator looks at the stock market’s median price-to-earnings (P/E) ratio to measure valuation. For those unfamiliar, the P/E ratio is the price of a stock divided by its earnings per share. The higher the ratio, the more investors...

by NelsonCorp Wealth Management | Sep 29, 2022 | Indicator Insights
Let’s say you’re an investor, and you want to place a bullish bet on the stock market. One way to do this would be to buy a call option. The value of a call option goes up when the price of a stock (or stock index) goes up—and it does so at a faster rate than...
by NelsonCorp Wealth Management | Sep 22, 2022 | Indicator Insights
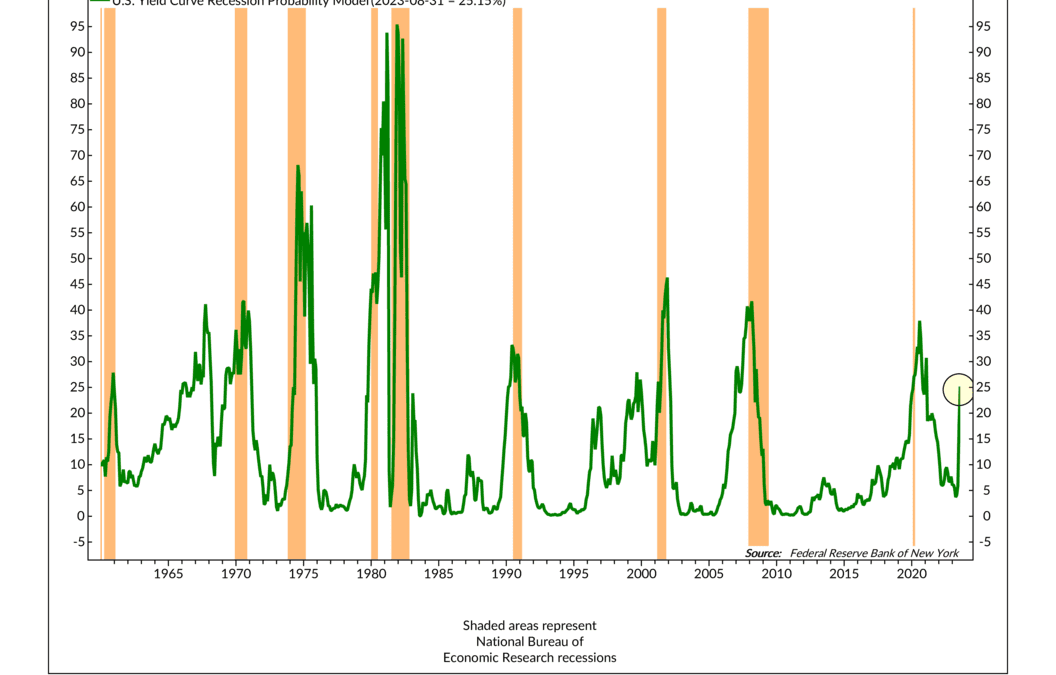
This week’s indicator looks at the yield curve and how its shape can be used to anticipate when an economic recession is becoming more likely. The portion of the yield curve that it focuses on is the 10-year Treasury rate and the 3-month Treasury rate. The New...

by NelsonCorp Wealth Management | Sep 15, 2022 | Indicator Insights
This week’s featured indicator examines the relationship between stock performance and inflation in the U.S. The indicator uses two main inputs: the year-to-year change in the Consumer Price Index (CPI) and the six-month smoothing or average of the CPI....
