
Banking Liquidity
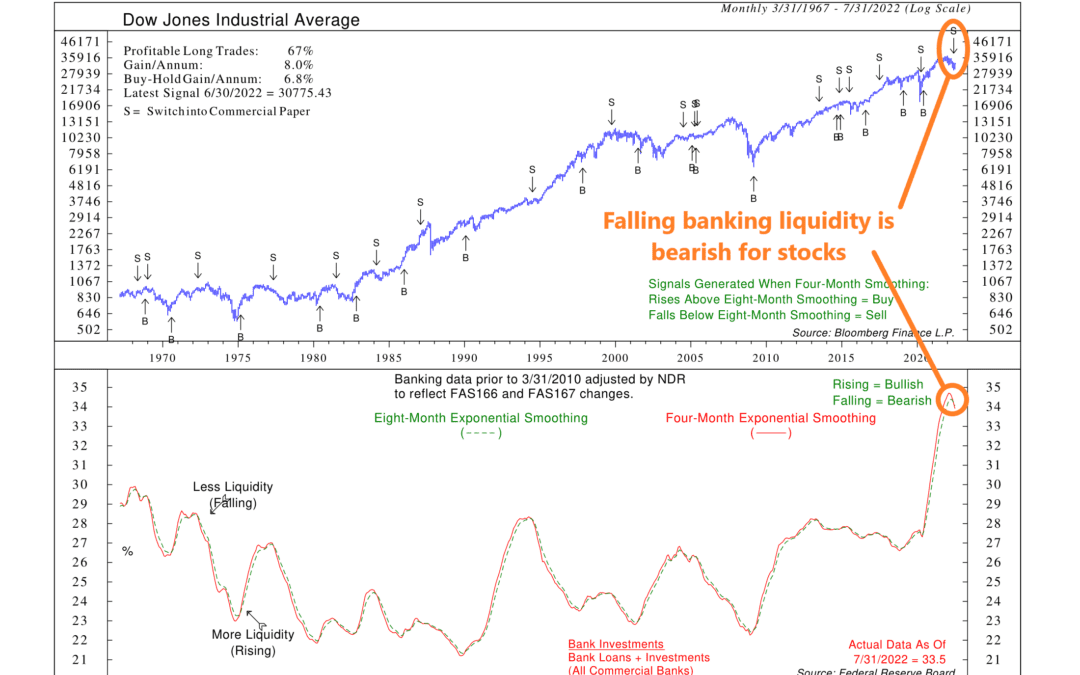
This week’s featured indicator looks at banking liquidity and how it affects stock market performance over time. The core idea is that a rising trend in liquidity is bullish for the stock market because it reduces pressure on interest rates. Falling liquidity,...
A Mixed Bag
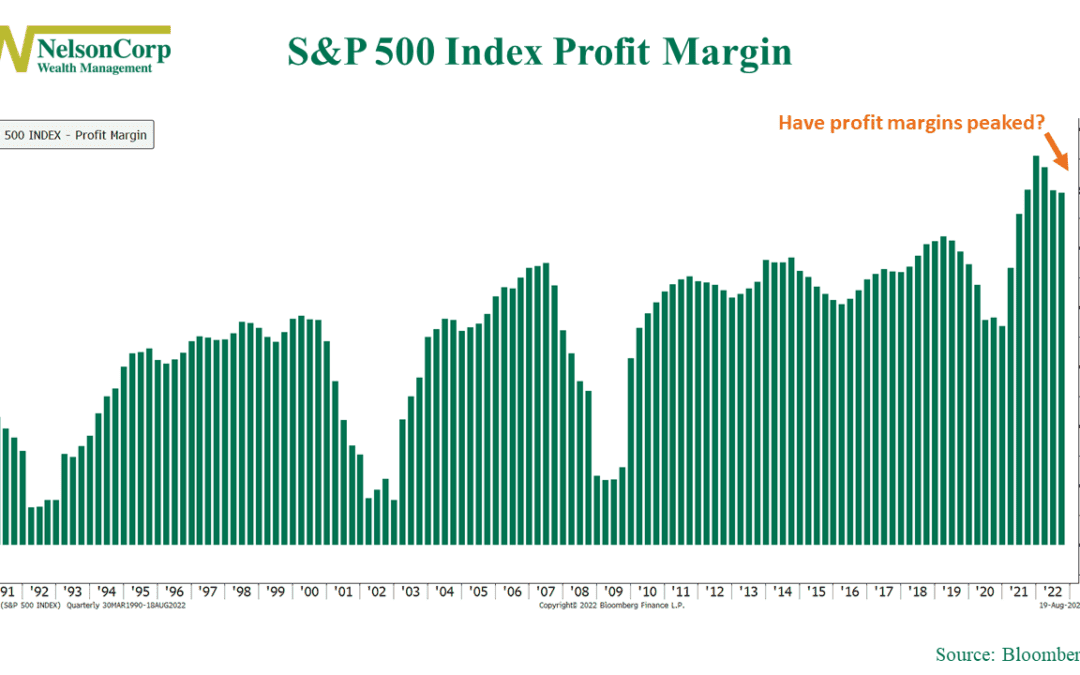
OVERVIEW The U.S. stock market slipped last week and ended in negative territory, resulting in the S&P 500 snapping its four-week winning streak. The Dow Jones Industrial Average decreased 0.16%, the Nasdaq Composite declined 2.62%, and the S&P 500...
Not for Sale
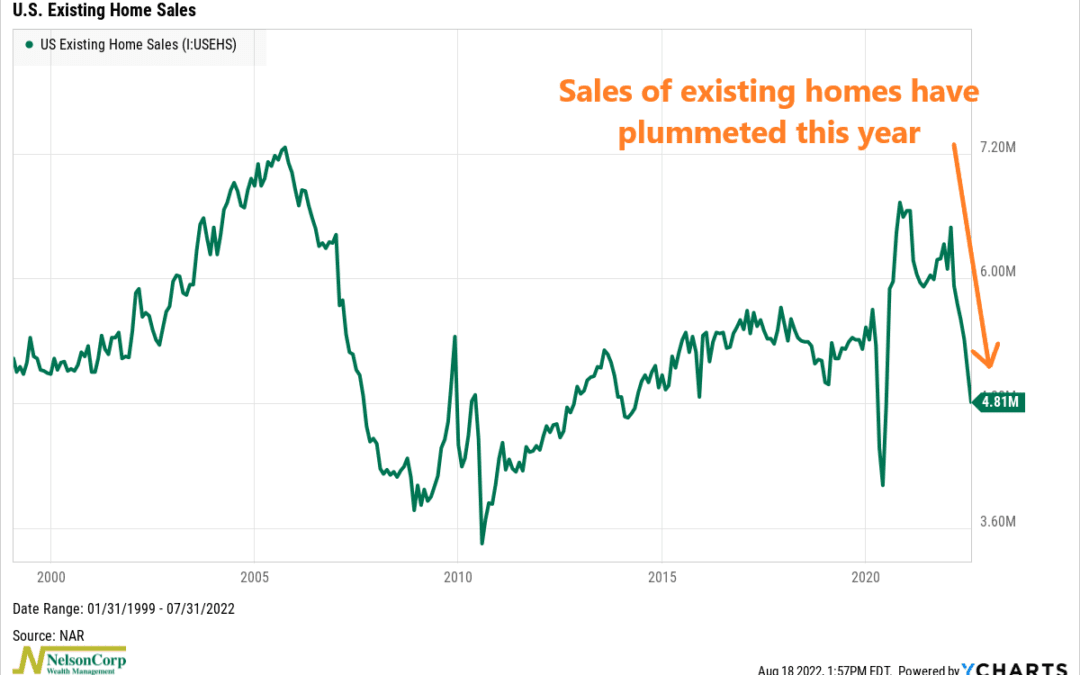
This week’s chart shows existing home sales in the United Sales going back to 1999. It tells us how many homes were sold each month—but only for homes that were already owned and occupied before coming onto the market. As you can see, they have crashed this...
Catching the Mega-Move
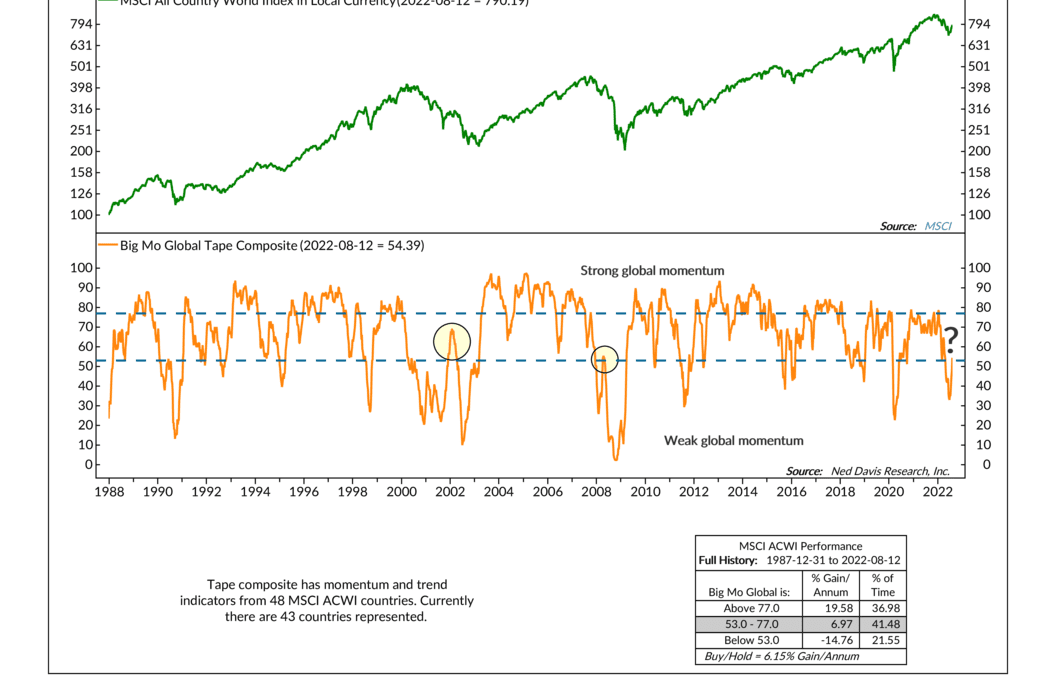
When big moves happen in the stock market, they tend to be global in nature. In other words, stock price momentum in one country can spill over into other countries, creating what we call a “mega-move” in global financial markets. To measure this dynamic, we...

Sometimes It Rhymes
OVERVIEW The U.S. stock market registered its fourth weekly gain last week. The S&P 500—an index of the 500 largest stocks in the United States—rose 3.26%. The Dow Jones Industrial Average gained 2.92%, and the Nasdaq Composite increased 3.08%. The biggest...
Recovery
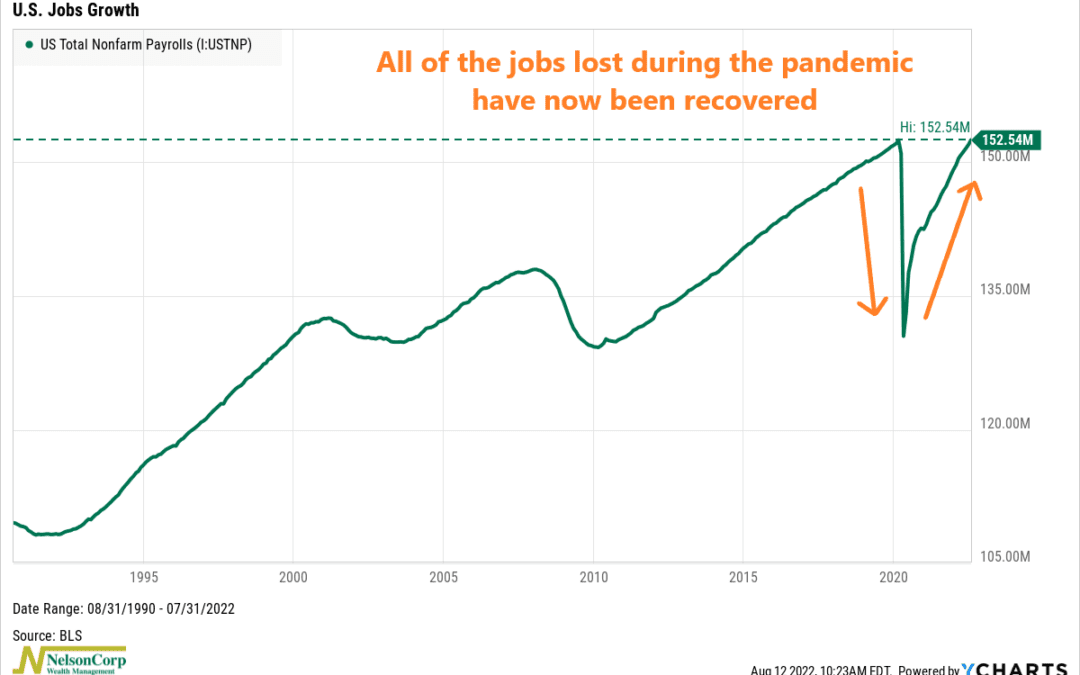
This week’s chart looks at job growth in the U.S. economy. Last month, we found out that U.S. employers added 528,000 new jobs. This was significant because it means the economy has now recovered all of the roughly 22 million jobs it lost in the early stages of...
Wait for the Extreme and Then Lean
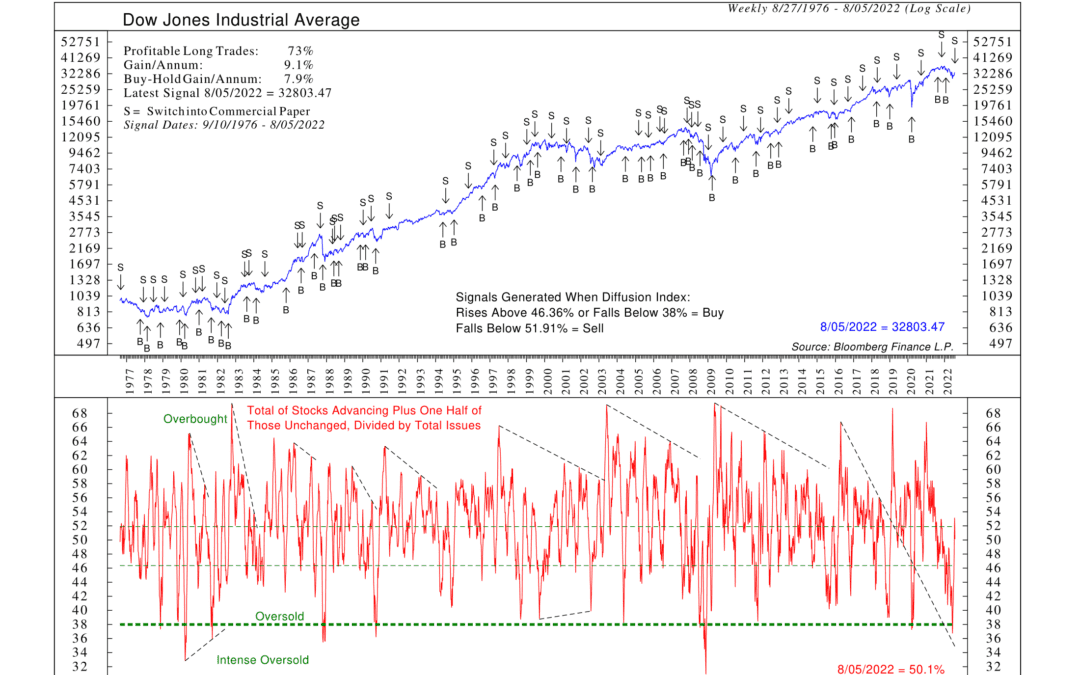
This week’s indicator is based on a contrarian concept originated by the investment bank Merrill Lynch. It looks at the ratio of the number of stocks advancing plus one-half of those unchanged to the total number of issues traded. In other words, it’s a measure...

Congestion
OVERVIEW The major U.S. stock indices put in mixed performances last week. While the S&P 500 Index gained a moderate 0.36% and the Nasdaq Composite surged 2.15%, the Dow Jones Industrial Average lost 0.13%. The gains came mostly from growth stocks, with the...
More Advancers Than Decliners
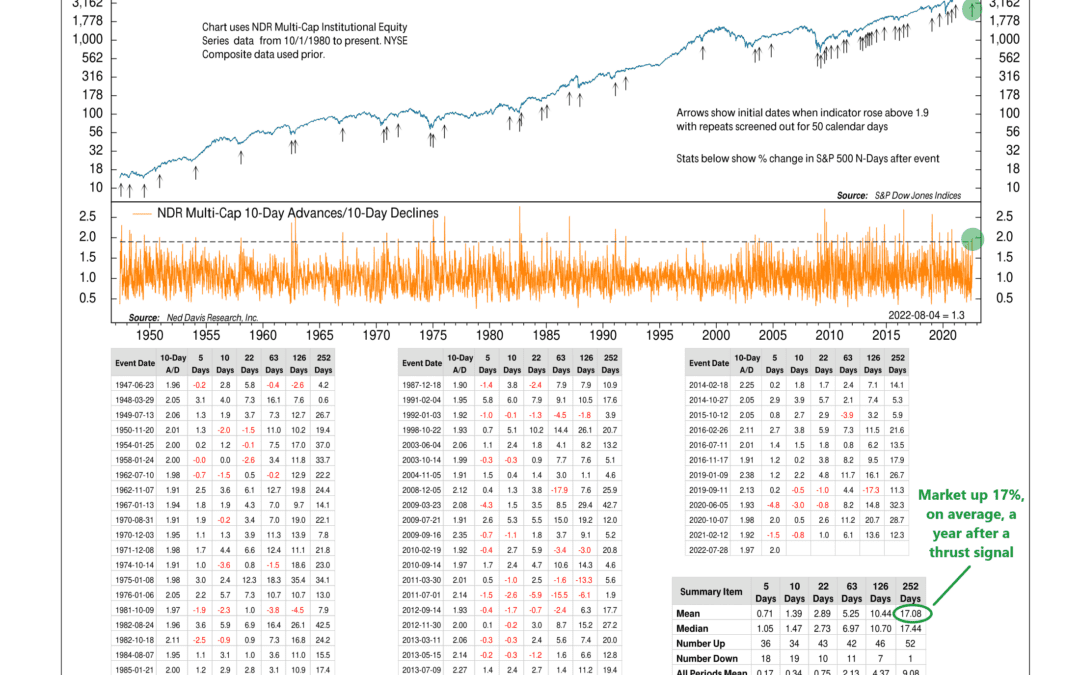
This week’s featured chart shows why the recent rally in the stock market might have some legs. The chart, shown above, is a “breadth thrust” indicator that measures the ratio of advancing stocks to declining stocks. Specifically, it takes the ratio of the...

Reversals
This week, I want to feature an indicator we’ve recently discussed on the blog. It’s a price-based indicator that measures reversals in the stock market. Specifically, it generates buy and sell signals for the S&P 500 index based on percentage reversals...

880 13th Avenue North
Clinton, Iowa 52732
563-242-9042
5465 Utica Ridge Road
Davenport, Iowa 52807
563-823-0532
9079 East Tamarack Drive
Dubuque, Iowa 52003
800-248-9042
info@nelsoncorp.com
Fax: 563-242-9062
Securities offered through Registered Representatives of Cambridge Investment Research, Inc., a broker-dealer, member FINRA/SIPC. Advisory services through Cambridge Investment Research Advisors, Inc., a Registered Investment Advisor. Cambridge and NelsonCorp Wealth Management are not affiliated. Financial Professionals may only conduct business with residents of the states or jurisdictions in which they are properly registered, licensed or exempt from registration and not all of the securities, products and services mentioned are available in every state or jurisdiction. Investing involves risk. Depending on the different types of investments there may be varying degrees of risk. Clients and prospective clients should be prepared to bear investment loss including loss of original principal.
Cambridge’s Form CRS (Customer Relationship Summary)
The information being provided is strictly as a courtesy. When you link to any of these websites provided herein, NelsonCorp Wealth Management makes no representation as to the completeness or accuracy of information provided at these sites. Nor is the company liable for any direct or indirect technical or system issues or any consequences arising out of your access to or your use of third-party technologies, sites, information, and programs made available through this site.